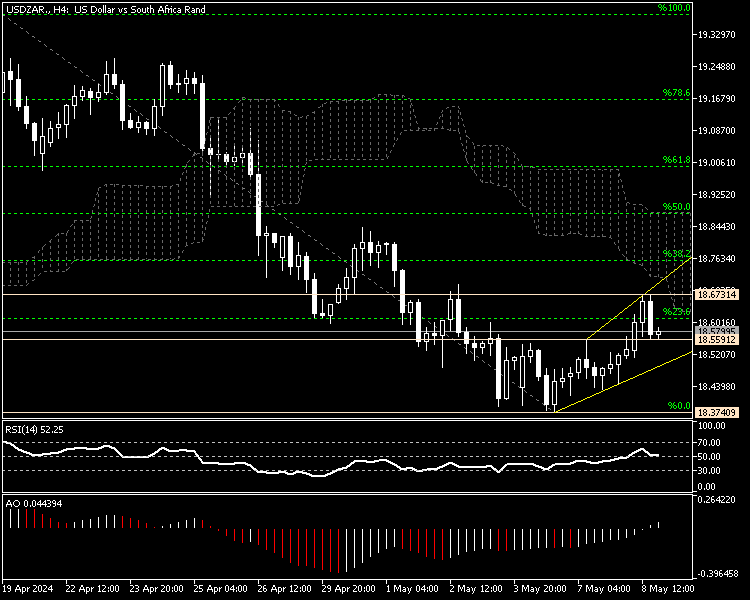
The U.S. Dollar dipped from 18.67 in today’s trading session against the African Rand. As of writing, the USDZAR pair trades at about 18.57, a level that is below the %23.6 Fibonacci and the Ichimoku cloud.
USDZAR Forecast – Growth Relies on Support at 18.55

The technical indicators are bullish, with the awesome oscillator bars flipped above the signal line and the RSI floating above the median line. None of the technical indicators show divergence in their diagram, which means it is unlikely for the trend to reverse from bearish to bullish.
According to the USDZAR 4-hour chart data, the current uptick momentum should be considered a consolidation phase. It is worth mentioning that the forex market always erases some of its recent losses before it dips again. Therefore, the consolidation wave that began at 18.37 could extend to the 38.2% Fibonacci, a more robust resistant area supported by the Ichimoku cloud.
This resistance level can provide decent demand for retail forex traders to join the bear market. However, traders and investors must monitor this resistance zone closely for candlestick patterns such as long-wick bearish candlesticks. The price must remain above 18.55 for this scenario to play out.
The Bearish Scenario
The USZAR’s primary trend is bearish. As displayed in the 4-hour chart above, the pair ranges below the Ichimoku cloud. However, the exchange rate should dip below the minor support 18.55 to trigger the bear market. In this case, selling pressure will escalate, and the downtrend will likely expand.
In this case, the next bearish target will likely be May’s all-time low, the 18.37 mark.