In today’s comprehensive XAUUSD technical analysis, we will first scrutinize the yellow metal’s price action and then meticulously delve into the fundamental analysis of gold.
Gold Technical Analysis Fibonacci Insights
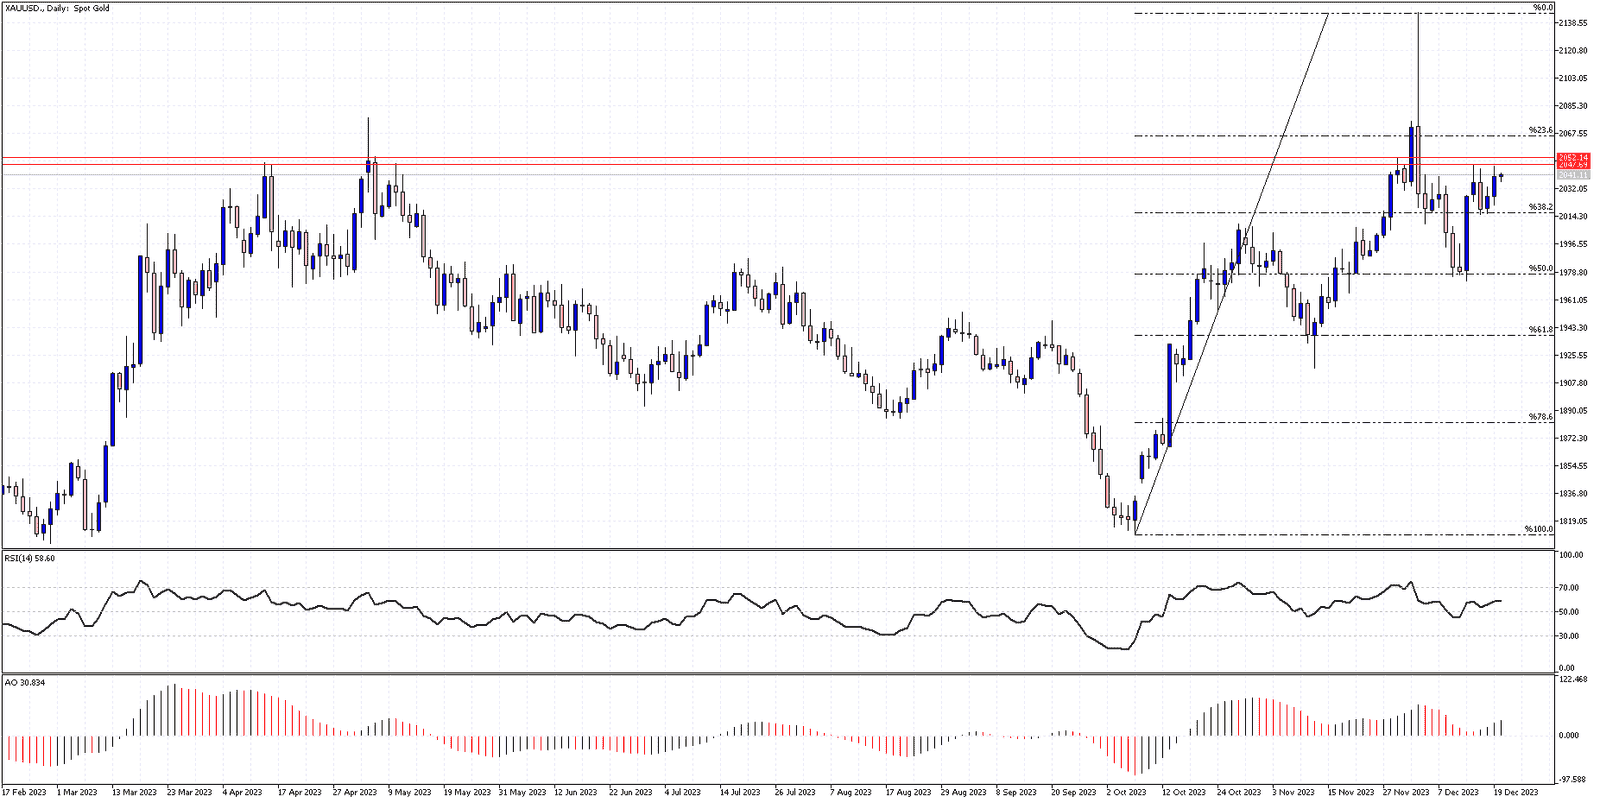
FxNews – Gold’s performance, as shown on the XAUUSD daily chart, recently rebounded from the 50% Fibonacci support level. The yellow metal trades above the 38.2% Fibonacci support, challenging the resistance range between $2,047 and $2,057.

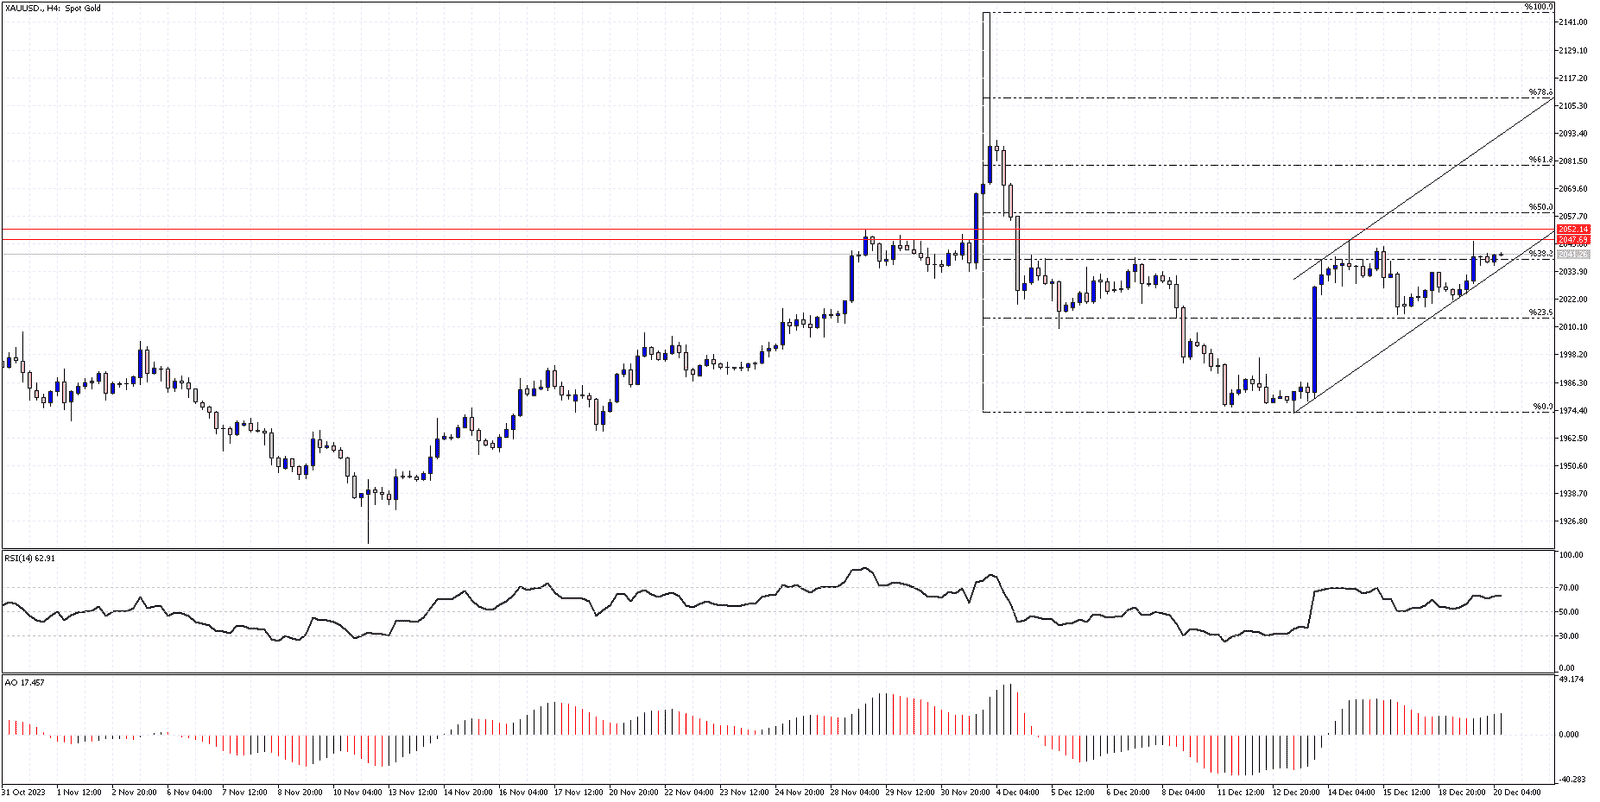
To better understand gold’s technical analysis, we can zoom into the 4-hour (4H) chart. Bulls are actively working to stabilize the price above the 38.2% Fibonacci level. Supporting this bullish momentum, technical indicators favor the buyers.
Notably, the Relative Strength Index (RSI) maintains its position above 50. Adding to this positive outlook, the Awesome Oscillator displays green bars, suggesting upward momentum. Therefore, if the bulls can maintain control at this level, it’s likely that gold prices will target the 61.8% Fibonacci resistance level.

However, there’s another side to consider. If gold prices were to fall below the current support, this bullish technical analysis would be negated. Such a dip would indicate a shift in market sentiment, potentially leading to a downward trend.