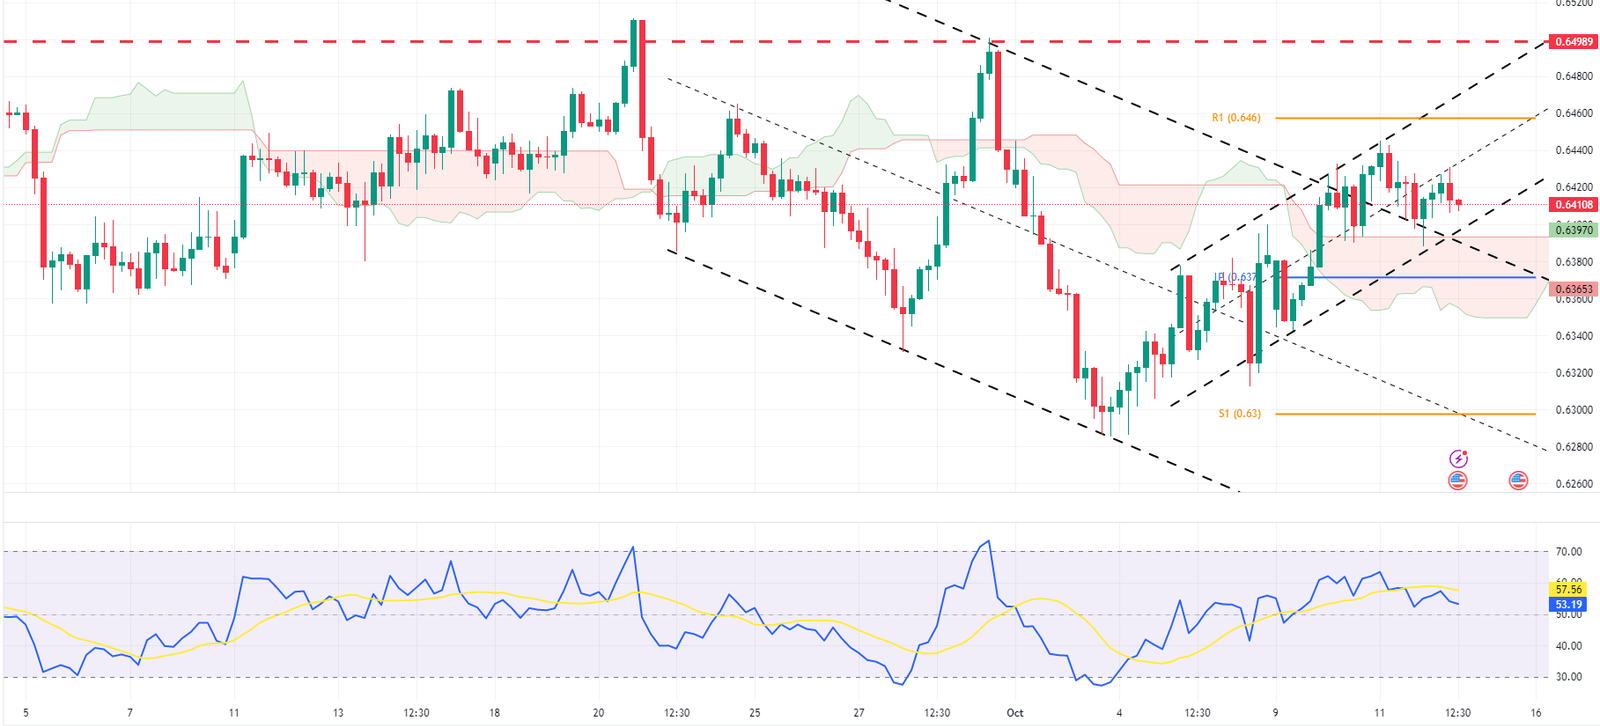
FxNews— The AUD/USD currency pair trades below the Ichimoku cloud on the daily chart. This positioning indicates a bearish sentiment in the market. However, there’s potential for growth as the currency pair has room to test the resistance levels between 0.6498 and 0.652.
The RSI indicator crossing the 50 level further supports this possibility. Despite the prevailing bearish sentiment, bulls are optimistic about testing these resistance levels.

AUD/USD Breaks Out of Bearish Channel Showing Bullish Signs
Transitioning to a closer look at the AUDUSD 4-hour chart, we observe a significant shift in market dynamics. The currency pair has broken out of the bearish channel and has formed a new trend within the bullish channel. The Ichimoku cloud now sits below the price, indicating a bullish sentiment in this timeframe.

A closer look at the AUDUSD 1-hour chart shows that the pair trades within a rising channel. This pattern typically indicates a bullish sentiment, suggesting that buyers are currently dominating the market.

Summary
In light of these observations, shorting AUDUSD at this stage is not recommended. A more prudent approach would be to wait for the bulls to drive the price into the Ichimoku cloud before selling near the 0.6498 level. This strategy minimizes risk by allowing for a smaller stop loss while maximizing potential rewards from the trade.
- Next read: Germany Economy Slowdown: October-12-2023
In conclusion, this comprehensive analysis provides traders valuable insights into current AUDUSD market dynamics and offers a strategic approach to trading this currency pair.