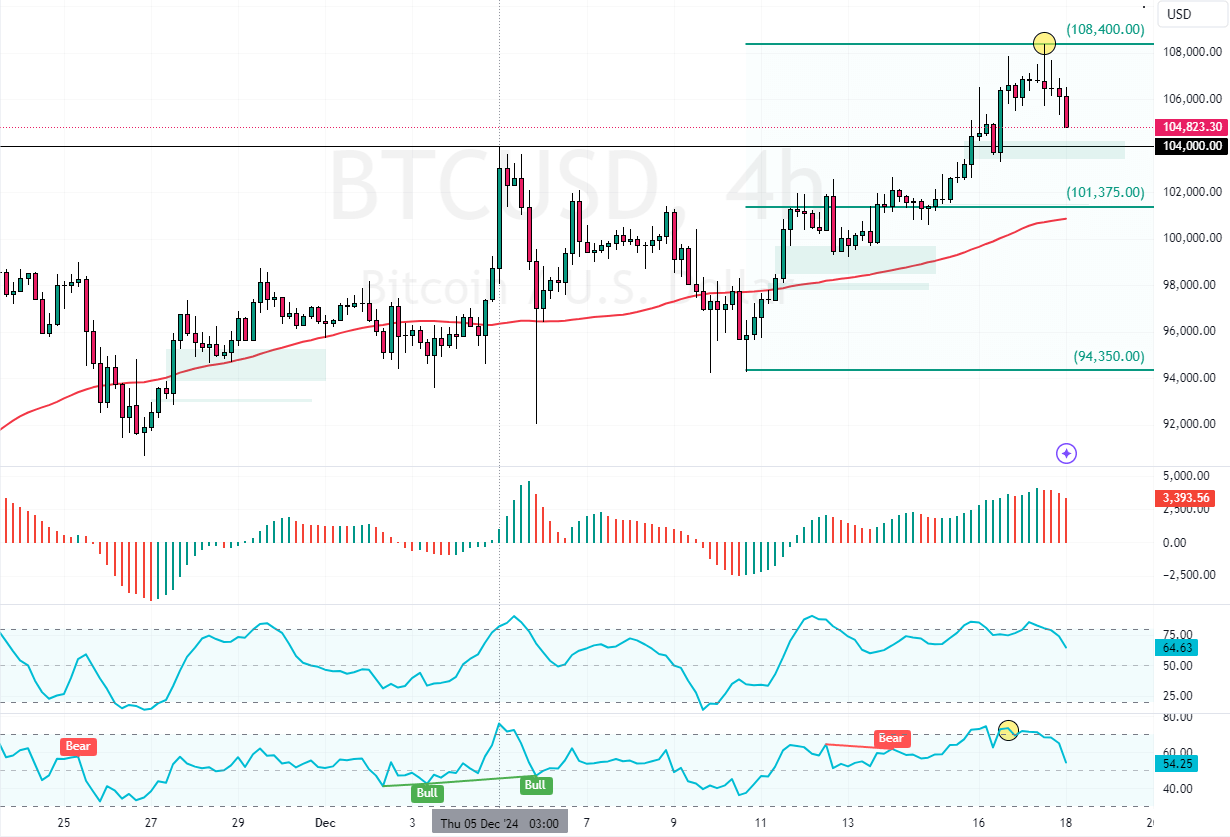
Bitcoin hit a new high at $108,400 on Tuesday. Concurrently, stochastic hinted at a temporary overbought market, causing the cryptocurrency to decline from its all-time high.
Retail traders and investors should monitor $104,000 and $101,375 support for bullish signals such as candlestick patterns. These supply zones can offer a decent bid to join the bull market.

Bitcoin Technical Analysis – 18-December-2024
Bitcoin is in an uptrend, above the 75-period simple moving average. The bullish wave eased after the prices hit a new high at $108,400. However, the robust buying pressure drove the Stochastic and RSI 14 into overbought territory, making Bitcoin overpriced, at least in the short term.
As of this writing, BTC/USD is trading at approximately $104,800, pulling away from all-time highs.
Key Bitcoin Levels to Watch: $101,375 and $104,000
The key support level that divides the bull market from the bear market is $101,375. Please note that Bitcoin’s trend outlook remains bullish as long as prices are above this level.
- Good reads: Litecoin to Extend Gains Above $124
That being said, due to Overbought signals, the bears are likely to push the prices toward the key support level. In this scenario, retail traders and investors should closely monitor the $104,000 and $101,375 supply zones for bullish signals, such as candlestick patterns, as these levels offer reasonable and low-risk entry prices.