FxNews—Gold trades bearish from $2,685. The yellow metal crossed below the 100-period simple moving average, which neighbors the September 26 low ($2,625) this week. As of this writing, the XAU/USD pair tests yesterday’s low at $2,600 as resistance.
The 4-hour chart below demonstrates the price, support, resistance levels, and technical indicators utilized in today’s analysis.
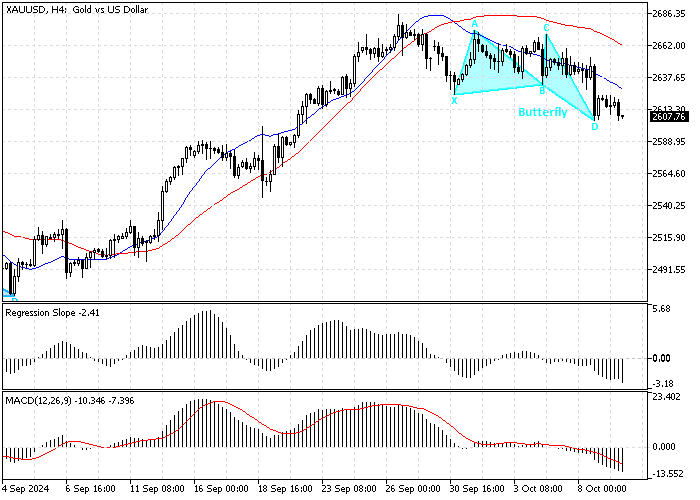
XAUUSD Technical Analysis – 9-October-2024
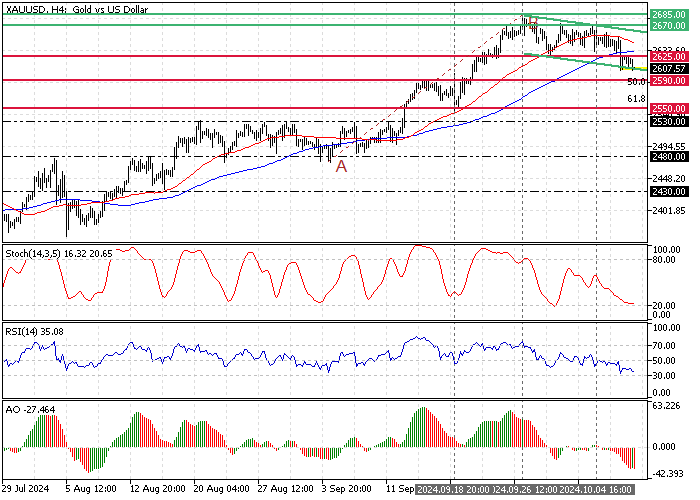
The Stochastic Oscillator and the Relative Strength Index indicators record 20 and 35 in the description, respectively, meaning the Gold price is not oversold, and the downtrend could resume. Additionally, the Awesome Oscillator histogram is below the signal line and red, meaning the bear market prevails.
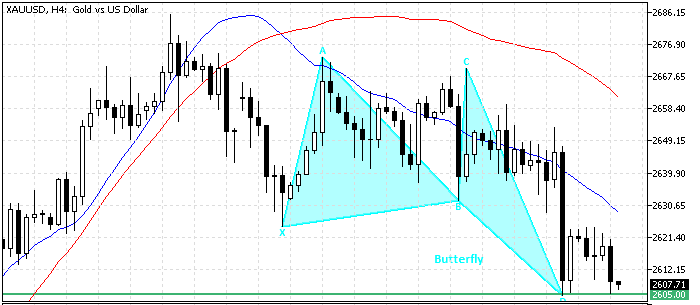
As for the harmonic pattern, the 4-hour chart formed a bullish ‘Butterfly’ pattern, indicating the bear market could end soon.
Overall, the technical indicators suggest the primary trend is bearish, but the trend has the potential to reverse from bearish to bullish.
Gold Price Forecast – 9-October-2024
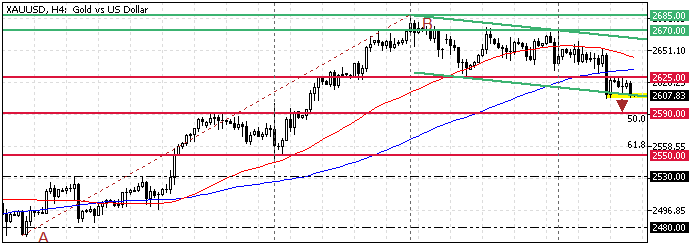
Immediate resistance rests at $2,625, the 100-period SMA. If the price remains below this resistance, the current downtick momentum is likely to extend. In this scenario, the next bearish target could be the September 16 high at $2,590.
Furthermore, if the selling pressure pushes the XAU/USD value below the $2,590 mark, the next support will be the September 18 low at $2,550.
Gold Bullish Scenario
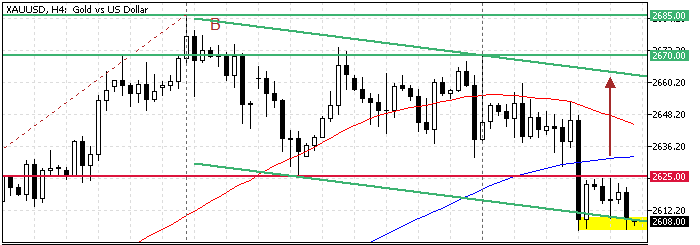
From a technical perspective, if bulls pull the Gold price above the $2,625 immediate resistance and the 100-period SMA, a new bullish wave will likely emerge. If this scenario unfolds, the trend should be considered bullish, with bulls’ initial target at $2,670 (October 4 High).
- Also read: USD/MXN Gains Amid Mexican Inflation Drops
Gold Support and Resistance Levels – 9-October-2024
Traders and investors should closely monitor the key levels below to make informed decisions and adjust their strategies accordingly as market conditions shift.
- Support: $2,590 / $2,550 / $2,530
- Resistance: $2,625 / $2,670 / $2,685