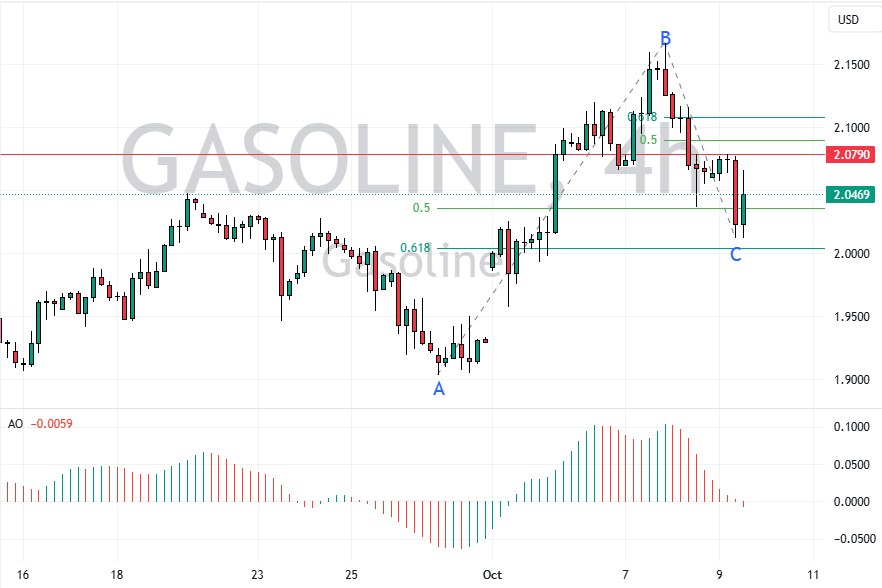
FxNews—Gasoline futures in the U.S. recently decreased, dropping from a high of $2.15 per gallon on October 7 to $2.05. This decline came after over a month of elevated prices due to concerns about crude oil availability for refineries.

Significant Increase in Crude Oil Supplies
The latest Energy Information Administration (EIA) report highlighted a significant surge in crude oil reserves. For the week ending October 4, stockpiles increased by almost 6 million barrels—triple what analysts had anticipated.
This substantial increase helped balance the sharp fall in gasoline supplies, which saw a reduction of 6.6 million barrels.
Impact of Chinese Economic Measures
The recent pullback in gasoline futures prices can also be attributed to doubts about the effectiveness of new economic measures introduced by China. Despite Beijing’s announcement of fiscal stimulus, there is skepticism about whether these efforts will sufficiently boost fuel demand.
This is particularly relevant as lower energy consumption in China has led the EIA to lower its global oil demand forecast by 300,000 barrels per day, adjusting it to 1.2 million barrels per day.
Gasoline Technical Analysis – 9-October-2024

The gasoline price bounced from the 61.8% Fibonacci retracement level of the AB bullish wave at approximately $2.004. This level is supported by the 50- and 100-period moving averages in the 4-hour chart.
As of this writing, the bulls are trying to stabilize the gasoline price above the 50% Fibonacci retracement level at $2.035. Meanwhile, the Awesome Oscillator signals a sell, with the histogram flipping below the signal line and turning red.
Overall, the technical indicators suggest that the primary trend is bullish, but the price might trade sideways.
Gasoline Price Forecast – 9-October-2024
The October 24 low at $2.065 is the key barrier to the current bullish momentum. If the gasoline price remains below this mark, a new bearish wave will likely emerge. In this scenario, the current pullback from $2.065 could potentially extend to immediate support at $2.035.
Furthermore, if the selling pressure pushes the price below the $2.035 mark, the next bearish target could be a revisit to the 61.8% Fibonacci retracement level at $2.000.
Bullish Scenario
From a technical perspective, if bulls close and stabilize the price above the $2.065 mark, the current bullish momentum could extend to the BC wave’s 50% Fibonacci retracement level at $2.089.