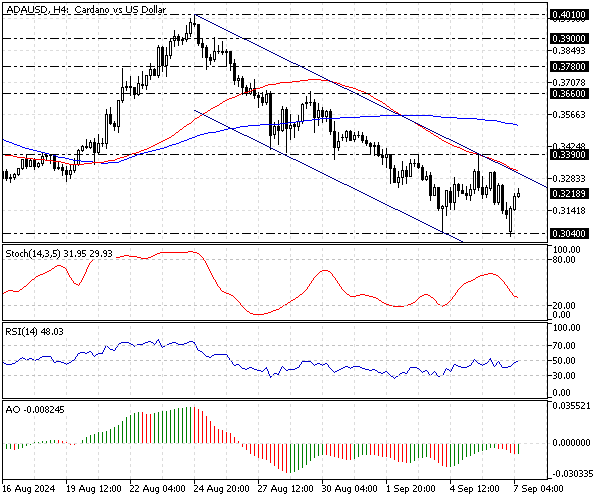
FxNews—Cardano trades inside the bearish flag and below the 50- and 100-period simple moving average in the 4-hour chart. The downtrend eased when the ADA/USD price dipped to $0.304 (September 4 Low).
As a result, the price bounced and is currently trading at about $0.323, moving toward the 50 SMA in conjunction with the upper line of the bearish flag.
The 4-hour chart demonstrates Cardano’s price, key support and resistance levels, and the indicators utilized in today’s technical analysis.

Cardano Analysis – 7-September-2024
The ADA/USD is in a bear market; however, the RSI 14 and Awesome oscillator indicators signal divergence, meaning Cardano could potentially erase some of its recent losses.
On the other hand, the stochastic oscillator value is declining, recording 32 in its %K line, meaning the ADA/USD price is not oversold, and the downtrend could resume.

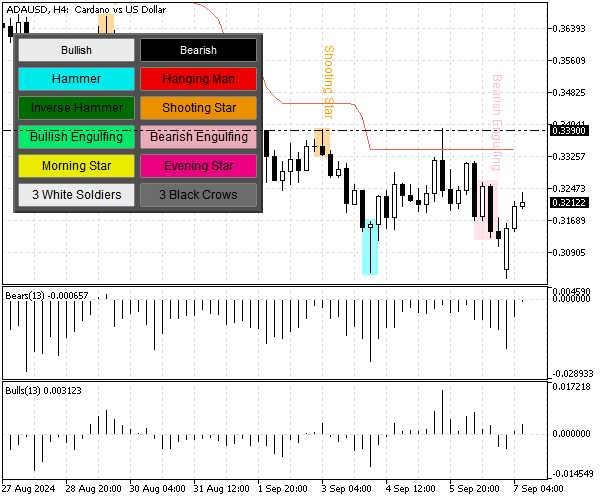
As for the candlestick pattern, a bearish engulfing pattern formed in the 4-hour chart after the price tested the September 3 high at $0.339. Furthermore, the Cardano price remained below the Super trend indicator, signifying that the bear market is still intact.
Overall, the technical indicators and the candlestick pattern suggest the primary trend is bearish, and the downtrend will likely resume after a mild correction phase.
Cardano Forecast – 7-September-2024

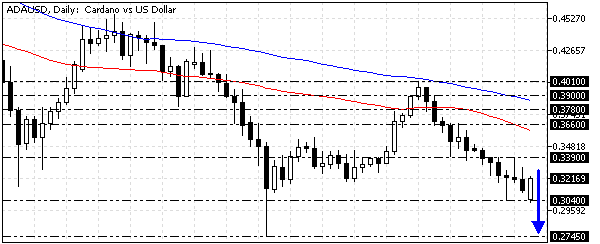
From a technical standpoint, the primary trend is bearish, with immediate resistance at $0.339. If the bears maintain their position below the 50-period simple moving average and the $0.339 resistance, the downtrend will likely resume and initially break below the September 4 low at $0.304.
In this scenario, the downtrend will likely target the August 5 low at $0.274. Please note that the bearish scenario should be invalidated if the price exceeds the September 5 high, the $0.339 mark.
- Also read: Ripple Technical Analysis – 6-September-2024
Cardano Bullish Scenario – 7-September-2024

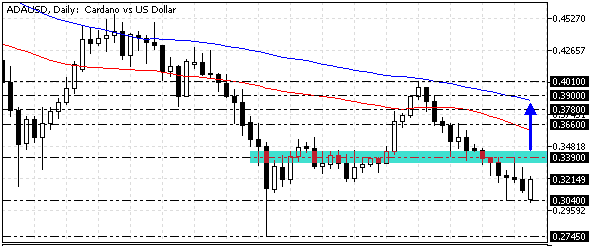
The key bullish barrier holds steady at $0.339. The pullback from $0.304 will likely extend to the 100-period simple moving average if the bulls (buyers) push the price beyond $0.339.
Furthermore, if the buying pressure exceeds the 50-period SMA, the next resistance area will be the August 29 high at $0.366. It is worth mentioning that the 50-period simple moving average plays the primary support for the bullish scenario.
Cardano Support and Resistance Levels – 26-September-2024
Traders and investors should closely monitor the key levels below to make informed decisions and adjust their strategies accordingly as market conditions shift.
- Support: $0.304 / $0.274
- Resistance: $0.339 / $0.366 / $0.378
Disclaimer: This technical analysis is for informational purposes only. Past performance is not necessarily indicative of future results. Foreign exchange trading carries significant risks and may not be suitable for all investors. Always conduct your research before making any investment decisions.