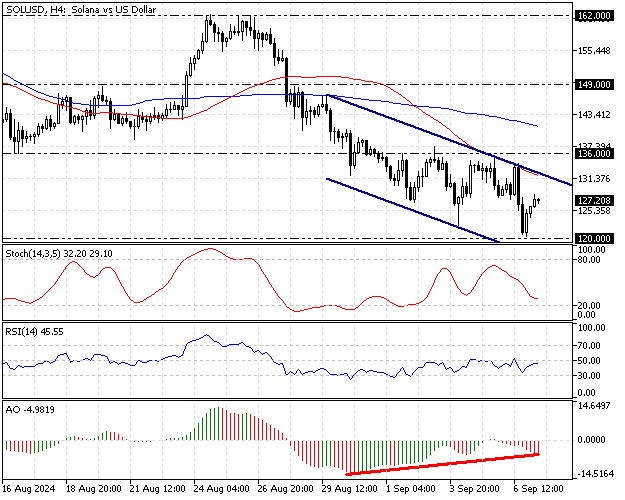
FxNews—Solana has been in a robust bear market since August 24, when the pair tested the August 9 high at $162. The downtrend cooled when the SOL/USD price dipped to as low as $120 on July 5.
As of this writing, Solana trades at approximately $127, correcting some of its recent losses. The daily chart below demonstrates the price, key trendlines, and indicators used in today’s technical analysis.

Solana Technical Analysis – 7-September-2024

Zooming into the SOL/USD 4-hour chart, we notice the price of the crypto pair trades inside the bearish flag and below the 50—and 100-period simple moving averages, meaning Solana is in a bear market.
- The Awesome oscillator bars are red and below the signal line, signifying the robustness of the bearish trend. However, the AO’s histogram also signals divergence, which could result in the market consolidating near upper resistance levels.
- The Relative strength index (RSI) is rising and nearing the median line. This development in the RSI 14 value means the bearish market is losing momentum.
- The stochastic oscillator value is 32 and not yet oversold, indicating the SOL/USD price could dip further.

Furthermore, a hanging man candlestick pattern is found in the 4-hour chart close to the September 3 high at $136, justifying the recent drop from that price. That said, the market is also below the Super trend line, meaning the downtrend prevails.
Overall, the technical indicators suggest the primary trend is bearish, the market is not oversold, and the price will likely target lower support levels.
Solana Price Forecast – 7-September-2024

The key resistance area to the bear market holds steady with the 50-period SMA at $136 (September 3 High). That said, the critical resistance level rests at $120, a robust supply area from which the price bounced four times in the current fiscal year.
From a technical perspective, the Solana bearish trend will likely resume if the sellers close and stabilize the price below $120. If this scenario unfolds, the next support level will be August 2023, low at $109.
Please be aware that the bearish scenario should be invalidated if the price crosses above the immediate resistance at $136.
- Also read: Cardano Analysis – 7-September-2024
Solana Bullish Scenario – 7-September-2024

As mentioned earlier in this article, the primary resistance for the bull sleeps at $136. For today’s uptick momentum to continue, the bulls must close and stabilize above the $136 critical resistance. Furthermore, If the price exceeds the 100 SMA, which neighbors the $136 mark, the Solana correction phase will likely extend to $149, the August 20 high.
Please note that the 100-period SMA will be the primary support for the bullish scenario, and it should be invalidated if the SOL/USD price dips below it.
Solana Support and Resistance Levels – 7-September-2024
Traders and investors should closely monitor the key levels below to make informed decisions and adjust their strategies accordingly as market conditions shift.
- Support: $120 / $109
- Resistance: $136 / $149 / $162
Disclaimer: This technical analysis is for informational purposes only. Past performance is not necessarily indicative of future results. Foreign exchange trading carries significant risks and may not be suitable for all investors. Always conduct your research before making any investment decisions.