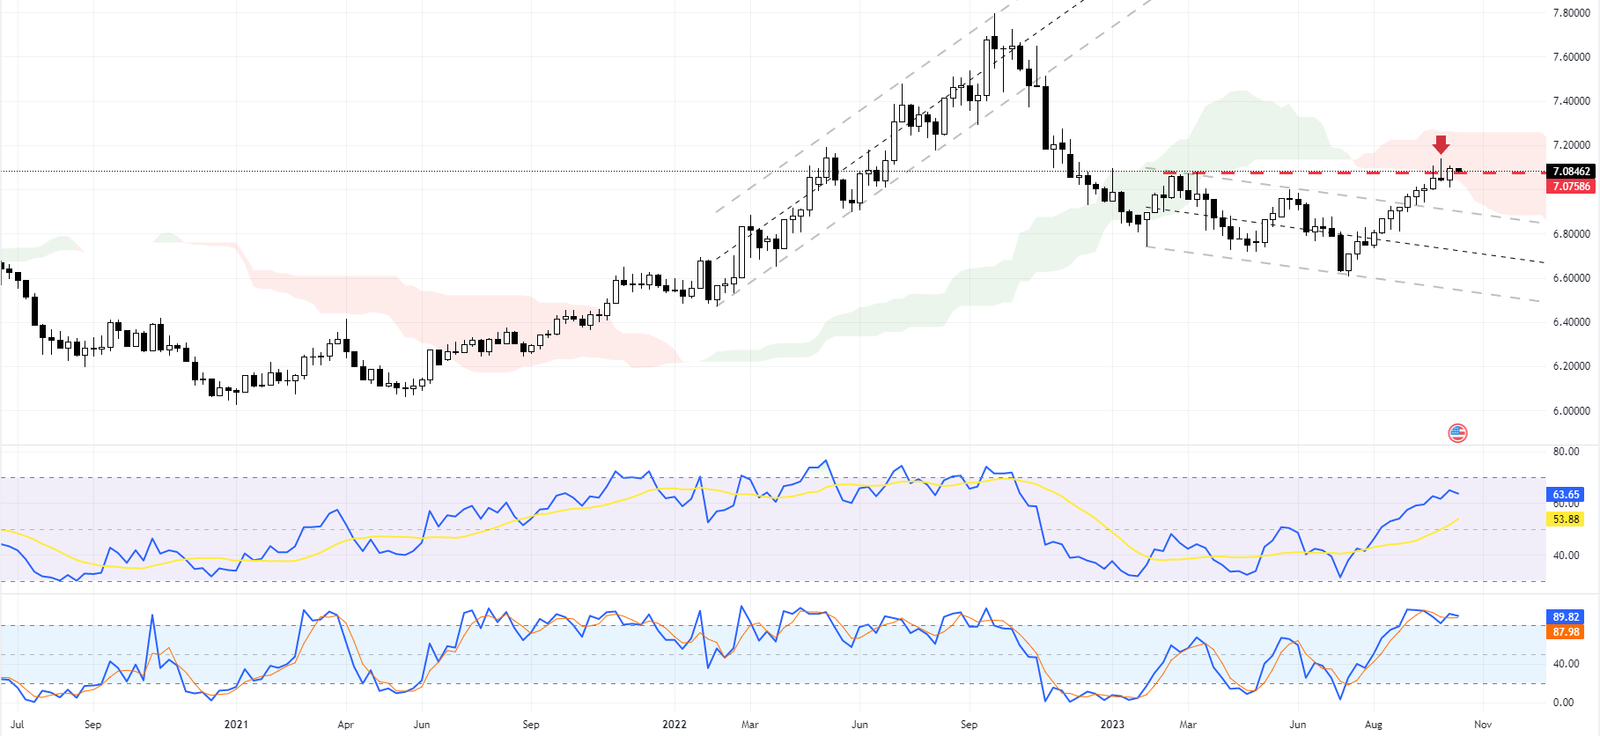
Our comprehensive USDDKK forecast shows that the breakout attempt of the USD DKK currency pair at the 7.075 level is still a significant factor to consider. Last week, the US Dollar and the Danish Krone price experienced an uptick, making the 7.075 resistance level crucial for its future upward trajectory.
Comprehensive USDDKK Analysis and Forecast – October 2023
The Stochastic oscillator has been in the overbought zone since early September, indicating intense buying pressure.

Three key factors make this resistance level necessary:
- The 7.075 level aligns with the Ichimoku cloud, a popular technical indicator.
- The Stochastic oscillator is in the overbought zone, suggesting a potential price reversal.
- A long wick candlestick pattern has formed near the resistance area, often a sign of market indecision.
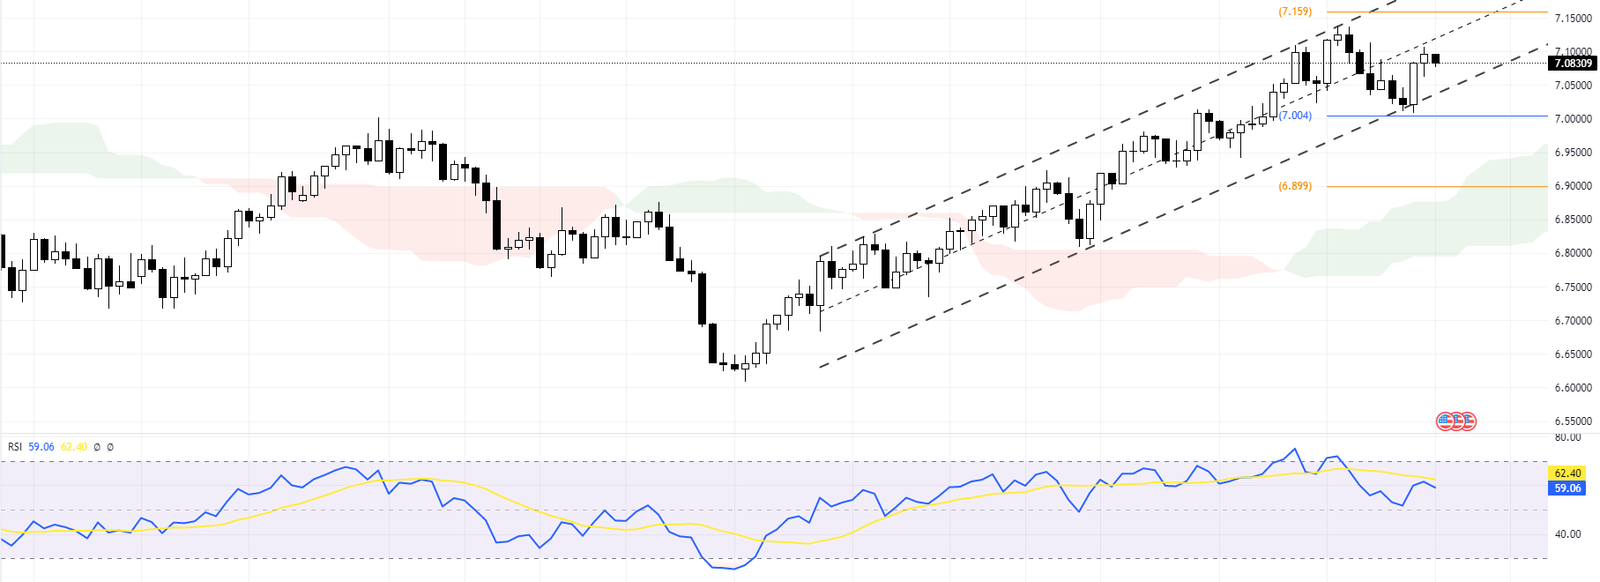
Upon closer inspection of the USDDKK daily chart, we find that the currency pair trades within a bullish channel. The RSI indicator and Stochastic oscillator hover above the 50 level, indicating a bullish market sentiment.

USDDKK Forecast
Currently, the USDDKK is trading above the 7.0 pivot within the bullish channel. Despite the weekly resistance and the Stochastic oscillator being in the overbought area, our analysis concludes that the pair is oversold. As such, we advise against initiating long positions at this point unless there’s a bullish close above the weekly resistance.
We recommend traders wait for further development in the USDDKK trend. If bears close below the 7.0 pivot on the daily chart, shorting the pair could be a more reasonable strategy with higher reward potential and lower risk.