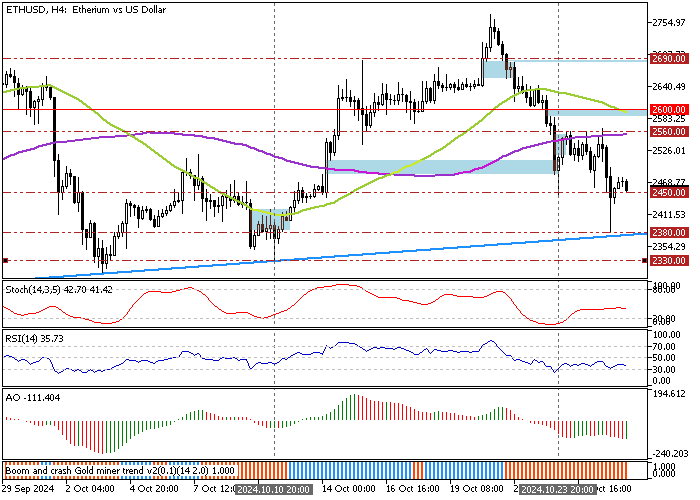
FxNews—Ethereum bounced from the ascending trendline at $2,380, trading slightly above the $2,450 (October 23 Low) immediate support as of this writing.
The ETH/USD 4-hour price chart below demonstrates the price, support, resistance levels, and technical indicators utilized in today’s analysis.

Ethereum Technical Analysis
The ADX indicator records 19 in value, meaning the market has no significant trend. Additionally, the RSI and Stochastic Oscillator are shown in the description as 36 and 43, respectively, meaning that ETH/USD is in a bear market and is not oversold. Hence, the downtrend could resume.

Overall, the technical indicators suggest the primary trend is bearish and should resume.
- Also read: Solana Eyes $194 Despite Overbought Signals
Ethereum Price Forecast

The immediate resistance is the October 23 low, $2,450. If Ethereum’s value dips below $2,450, the downtrend will likely resume. In this scenario, the October low at $2,350 will likely be revisited.
Furthermore, if the selling pressure exceeds $2,380, the bearish trend could test the October 10 low at $2,330.
Bullish Scenario
If ETH/USD holds above $2,380, the current uptick momentum that began at $2,330 will likely resume at the next resistance level at $2,560, backed by the 100-period SMA.
Ethereum Support and Resistance Levels
Traders and investors should closely monitor the key levels below to make informed decisions and adjust their strategies accordingly as market conditions shift.
- Support: 2,450 / 2,380 / 2,330
- Resistance: 2,560 / 2,600 / 2,690