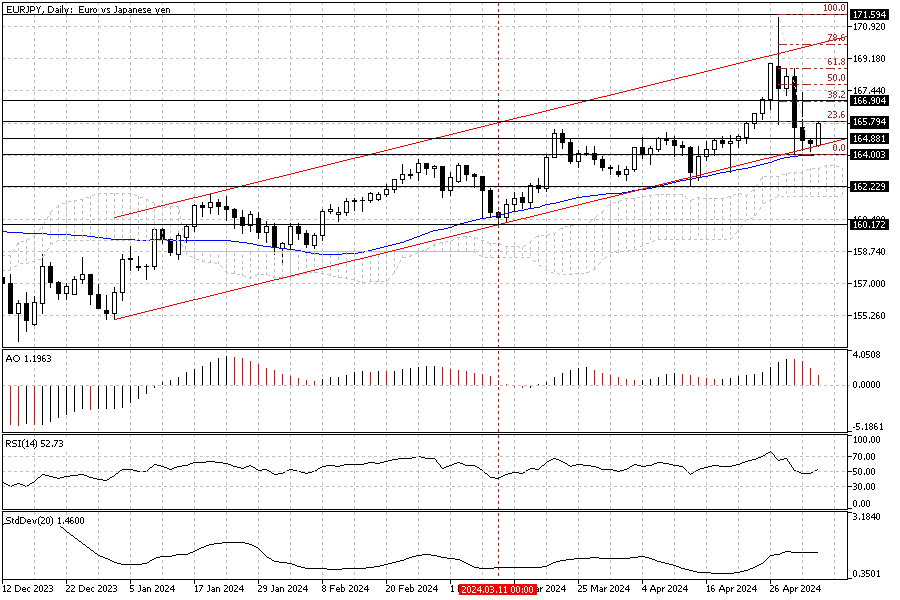
In our previous EURJPY technical analysis, we pointed out that the pair is testing the lower line of the bullish channel, as shown in the day chart below.

As of this writing, the European currency holds its position inside the channel and above 164.0 support, which coincides with EMA 50. We zoom into the 4-hour chart to better understand the market movement and find the key levels to help us forecast the EURJPY’s next move.
Key Levels to Watch in USDJPY Following Yen Surge

The Japanese Yen strengthened against the U.S. dollar last week, and consequently, the trend shifted below the Ichimoku cloud, as depicted in the 4-hour chart above. The pair trades at about 165.5 when writing, slightly below the 165.7 key level.
The technical indicators are bullish, with the RSI above to close and cross above 50. Interestingly, the awesome oscillator bars are green and nearing the signal line. The Standard Deviation indicator shows 1.39 in its value, which indicates that the mark is trending.
EURJPY Forecast – 165.7 to 166.9 Levels Explored
The bulls must close and stabilize the price above the 165.7 mark for the uptrend to resume, a minor resistance in conjunction with the 23.6% Fibonacci retracement level.
If this scenario comes into play, the price of EURJPY will likely rise to test EMA 50 and the 38.2% Fibonacci level, the 166.9 mark. The 166.9 resistance mark has the Ichimoku cloud as its backup, which makes this barrier harder to cross. Therefore, if the price reaches 166.9, what will happen next is unclear.
Bearish scenario

The downtrend could extend further since the pair hovers below the Ichimoku cloud in the 4-hour chart. If the bears close below 164.8, the decline that began at 171.5 would extend to 162.2 support.
Conclusion
The overall trend is bullish, with the EURJPY hovering inside the bullish channel. The uptrend will remain valid if the price is inside the flag. However, the market might see some decline and experience a consolidation phase, and it might test the lower band and the 164.0 mark again.
Therefore, traders and investors must closely monitor the key levels mentioned in the technical analysis to make informed decisions.