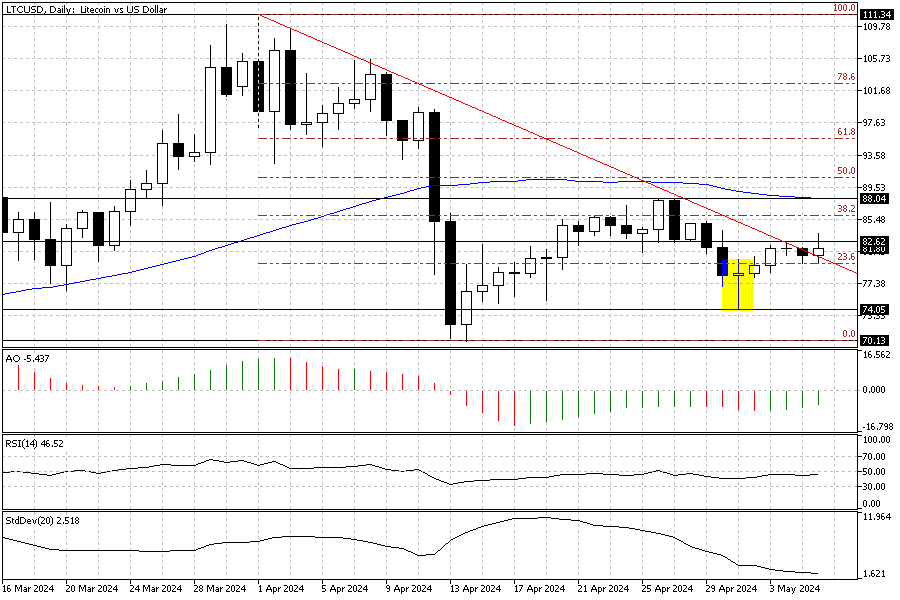
FxNews—In the previous Litecoin technical analysis, we pointed out that the market is bearish as long as the price ranges below the descending trendline, depicted in red in the daily chart below.
Long Wick Candlestick’s Impact on Litecoin’s Uptick
Today, the LTCUSD pair crossed above the descending trendline, and as of this writing, it trades at about $81.8.
It is worth noting that the current uptick momentum was expected because the pair formed a long wick candlestick pattern in the daily chart; the candlestick is highlighted in yellow in the image above.
While the technical indicators give mixed signals in the daily chart, we zoom into the 4-hour time frame to analyze the market behavior in detail and make the key points, which assists us in forecasting potential trading opportunities.
Bullish Signals Amidst Sideway Market Caution
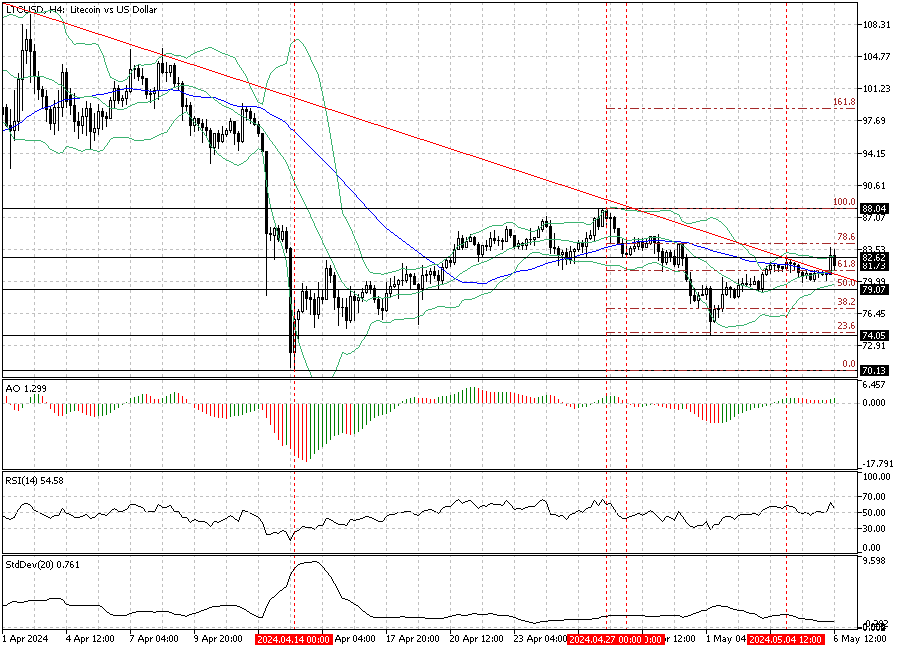
The breakout from the descending trendline is visible in the 4-hour chart. Interestingly, the technical indicator signals a bullish trend. The awesome oscillator bars are green and above the signal line, and the RSI hovers above 50 at about 53.6 when writing. But, the Bollinger band and the standard deviation warn a sideway market might be on the horizon.
The Bollinger bands are narrowing, and the standard deviation value is low at 0.7, interpreted as a weak trend. Therefore, traders and investors should approach the market cautiously.
Litecoin Key Hurdle is the $82 Mark
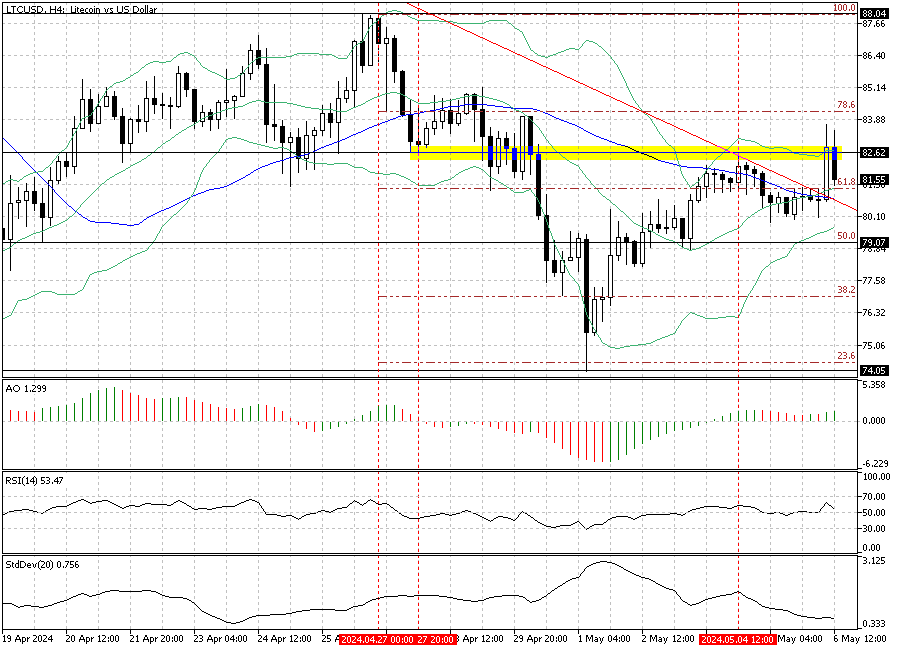
From a technical standpoint, the bulls crossed above the descending trendline but failed to close above the April 4th high, the $82.6 mark, which plays the key resistance level. For the uptick momentum to resume, the price must close and stabilize above the $82.6 mark. In this case, the Litecoin price will likely rise to the next barrier: April’s all-time high, the $88.0 mark.
That means traders should wait for the market to show bullish momentum above $82.6 before joining the bull market.
Litecoin Bearish Scenario
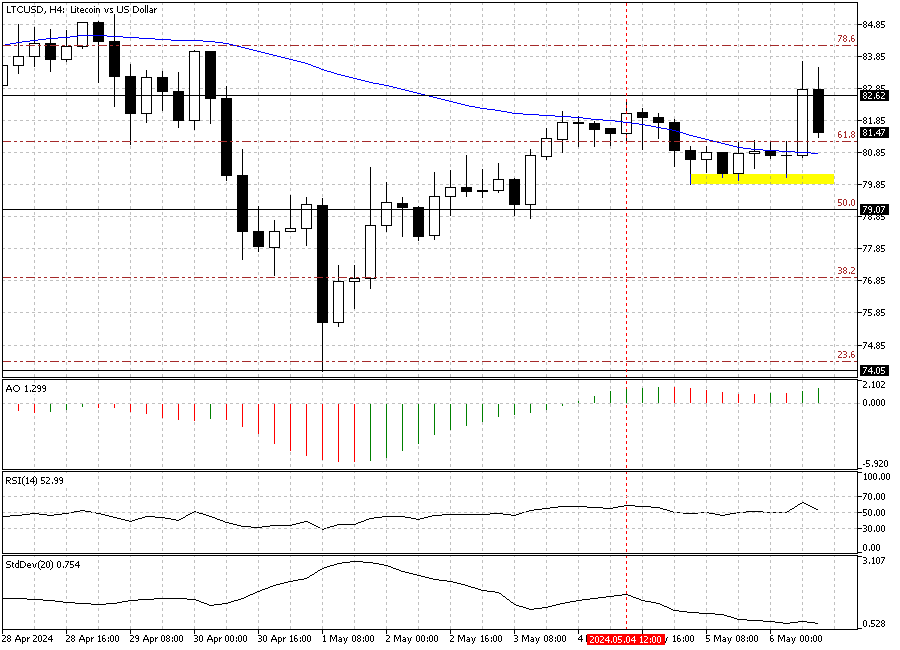
The primary trend is bearish, and the LTCUSD price is testing the broken trendline and EMA 50 in today’s trading session. If the Litecoin price falls below the %50 Fibonacci level or the $79.0 mark, the downtrend will likely continue, and the breakout mentioned earlier in the article should be flagged as a fake. If this scenario comes into play, the LTCUSD price will likely revisit $74, followed by March’s lowest point, $70.1.
Conclusion
The daily chart shows that LTCUSD is in a bear market since the price is below the 38.2% Fibonacci resistance and the EMA 50. However, there is an opportunity to join the pullback. The hammer candlestick pattern signals a potential rise. However, traders and investors who plan to buy Litecoin must consider the $79.0 support as their stop loss. If the price falls below this level, the decline will likely extend to $74, followed by $70.