In the ever-changing world of forex trading, staying ahead of the curve requires accurate forecasting. Our latest EURMXN forecast provides a comprehensive analysis of the current market trends and potential future movements. Let’s delve into the details.
EURMXN Forecast – 3 Triggers for Mexican Peso Plunge
The Mexican peso, or the value of Mexico’s money, has fallen to a six-month low, going past 18.25 per US dollar. This is mainly because the US dollar is getting stronger. This strength comes from data suggesting that US interest rates might stay high.

Increased Tensions Between Israel and Hamas
Bloomberg – Due to increased tensions between Israel and Hamas, people are investing more in ‘safe’ assets. Despite these factors, some positive signs in Mexico’s economy are helping the peso. The World Bank now expects Mexico’s economy to grow by 3.2% this year, which matches an updated forecast from the IMF.
High Inflation
Mexico’s industrial production has also done better than expected, showing a 5.2% increase compared to the expected 4.6%. Inflation, or the rate at which prices increase, is close to the target range of 2%-4% set by Banxico, Mexico’s central bank. It was lower than expected at 4.45%, while core inflation (which excludes volatile items like food and energy) stayed fairly steady at 5.8%. These factors support keeping the interest rate at 11.25% for the rest of the year.
EURMXN Forecast: A Technical Analysis
The EURMXN currency pair has recently shown significant activity. The weekly chart broke out of the bearish channel, indicating a potential shift in market dynamics. The pair tested this broken channel just last week, resulting in a price surge to an October high. This development marks a noteworthy point in our EURMXN forecast.
The weekly chart shows the trading pair below the Ichimoku cloud. This positioning is significant as it often indicates a bearish market sentiment. The recent gains witnessed in the market can be interpreted as a corrective phase of the ongoing downtrend. This suggests that these gains could be a temporary pause before the market resumes its downward trajectory. Stay tuned for more updates and in-depth market analyses.

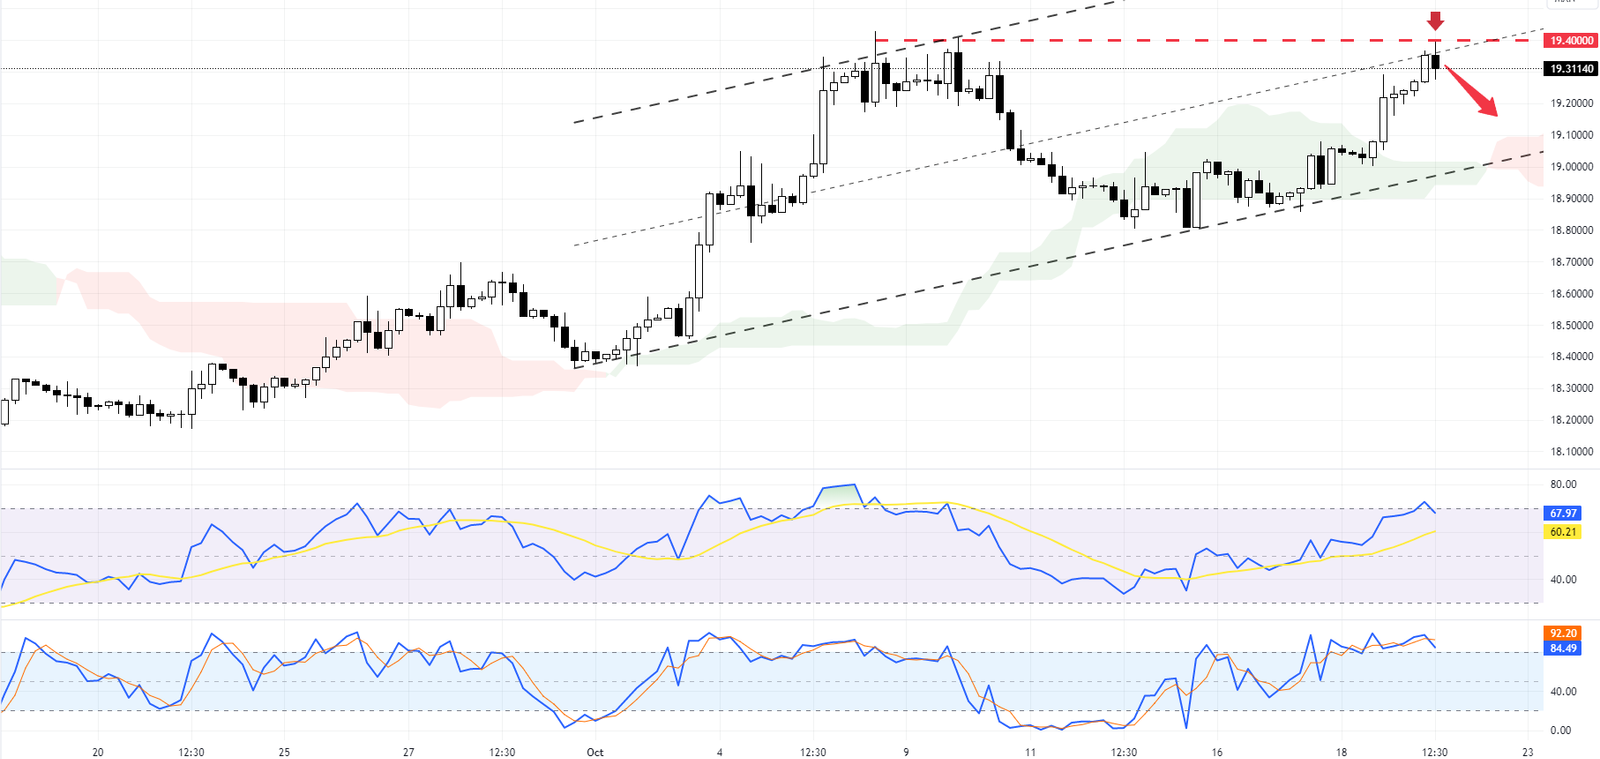
When we zoom into the 4-hour chart, we see that the EURMXN bulls encountered strong resistance around the 19.4 mark, which temporarily halted the rising momentum. Additionally, technical indicators such as the Relative Strength Index (RSI) and the Stochastic Oscillator are overbought, signaling that the market might be due for a correction. The Bollinger Bands echo this sentiment.

Given these technical indicators signaling an overbought market, our EURMXN forecast suggests that we might see sideways movement in the upcoming trading sessions before another attempt is made to break the 19.4 resistance. If there is a close above this level, it could pave the way for the bulls to reach the 19.6 resistance level.
Final Word
In conclusion, our EURMXN forecast is based on a swing trading strategy. It gives traders insights into potential future movements based on current market trends and technical indicators. As always, monitoring these indicators and adjusting trading strategies is crucial.