In our Gold Forecast October 2023, we delve into the intricate dynamics of the gold market. From the influence of global events such as the Middle East war to financial indicators like US Treasury yields, we examine how these factors have shaped gold’s price journey. Join us as we unravel the complexities of gold trading in these volatile times.
Impact of US Treasury Yields
Reuters – Gold is now selling for almost $1950 per ounce. It’s risen since the end of July, at $1810. In late September, gold’s value dropped quickly because US Treasury yields (the return on investment for US government debt) increased. But this stopped after a report about jobs came out. People started guessing that the Federal Reserve (the US central bank) might not increase interest rates in November but maybe in December.
Effect of the Middle East War
The war in the Middle East boosted gold’s price on Monday, 9 October. It’s still going on, but it’s already factored into the cost and probably won’t affect it much in the next few days. There’s no big movement of money from stocks or bonds, so there’s no real reason for people to buy gold.
We should also note that the war in the Middle East isn’t a good reason to bet on gold going up in the long term. The unstable situation doesn’t encourage steady demand. The conflict between Russia and Ukraine caused a similar jump in price, but that was because people were worried about supply from a major producer. Even then, the price ended up lower than where it started before the “war rally”.
Bond Prices and Equity Market
Meanwhile, bond prices have dropped again this week. The yield on 10-year Treasury bonds is close to 5% – the highest since 2007. It hasn’t been this high consistently since 2002. This is starting to make people nervous about investing in stocks, but gold isn’t affected by this yet, even though it was the main reason for its drop last month.
Gold is also holding steady against the dollar, which has gained back more than half of what it lost earlier in October. This means that gold is going up even though conditions aren’t favorable. It might start to lose momentum soon.
Gold Forecast – October 3 Shocks Jacked the Price
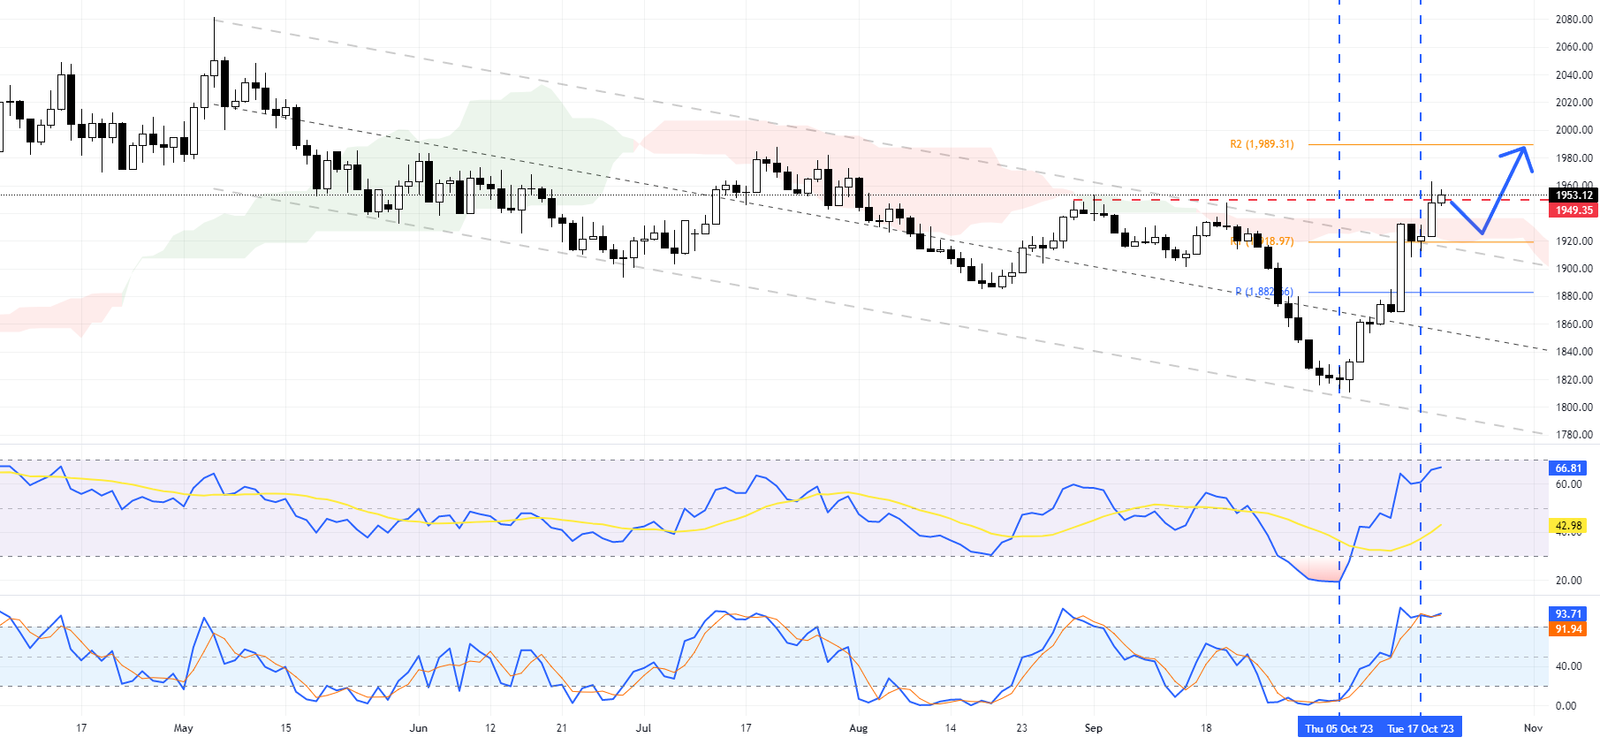
FxNews—The XAUUSD pair has been upward since October 25. This bullish trend was marked by a significant breakout from the bearish channel, which was tested on October 17. Currently, the yellow metal is surpassing its September high of $1,949 resistance and trading above the Ichimoku cloud.
The position above the Ichimoku cloud is a strong indicator of a bullish bias in the market. This suggests that investors are optimistic about gold’s future performance and are willing to buy at current prices in anticipation of further increases.

Regarding technical indicators, the Stochastic oscillator is currently in the overbought zone. This typically suggests that the asset has been bought excessively and could be due for a price correction. However, it’s worth noting that the Relative Strength Index (RSI), another momentum indicator, still has some room before reaching the overbought area.
This divergence between the two indicators suggests that while gold may be overbought according to the Stochastic oscillator, some upward momentum may still be left according to the RSI.
Given these conditions, there is potential for gold’s price to rise higher and target the $1,989 resistance level. However, it’s also possible that we might see a retest of the $1,920 level before any further gains are made. This could allow investors who missed out on the initial breakout to enter at a more favorable price point.
Final Words
In conclusion to our gold forecast for October, while gold’s current bullish trend and its position above the Ichimoku cloud suggest the potential for further gains, investors should also be mindful of technical indicators such as the Stochastic Oscillator and RSI, which indicate that a price correction could be on the horizon.