Bloomberg—In August 2024, the United States saw its trade deficit decrease to $70.4 billion, the smallest in the last five months. Initially, the deficit was higher at $78.9 billion in July, but this number was later adjusted. Experts had predicted the deficit would be around $70.6 billion, so the figure was slightly better than expected.
The chart below shows the US trade deficit for the last five months.

Record-Breaking Exports Boost the Economy
US exports rose by 2%, reaching an all-time high of $271.8 billion. This boost came from several sectors, with key contributors being telecommunications equipment, civilian aircraft, and computer accessories.
Other significant exports included industrial machinery, pharmaceuticals, nonmonetary gold, and passenger vehicles. The services sector also saw growth, particularly in areas related to travel and government services.
Decline in Imports Helps Narrow the Deficit
On the import side, there was a slight decline of 0.9%, with total imports amounting to $342.2 billion. The decrease was mainly due to lower imports of nonmonetary gold, finished metal shapes, crude oil, and cars. However, there was an increase in the import of services, particularly in travel and intellectual property usage fees.
Trade Relationships Show Improvement
The trade deficit also improved with key trading partners. Notably, the deficit with China decreased to $27.9 billion from $30.1 billion. The trade gap with Canada also narrowed significantly, dropping to $3.1 billion from $8.1 billion.
EURUSD Technical Analysis – 8-October-2024

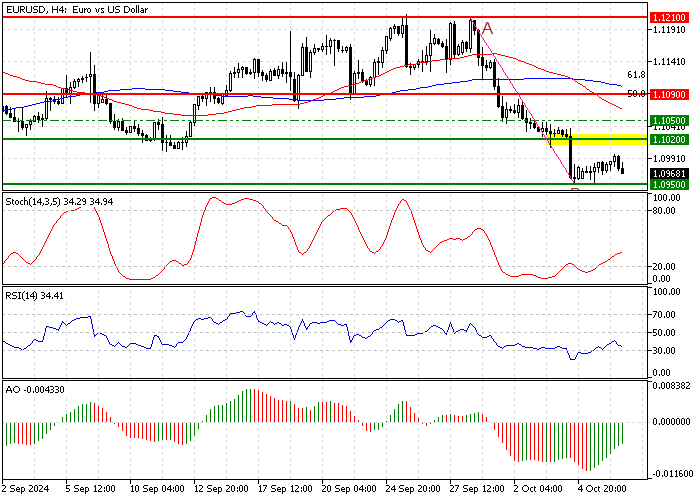
FxNews—The EUR/USD currency pair is consolidating above the $1.095 immediate support, the August 15 low. The primary trend should be considered bearish because the price is below the 50- and 100-period simple moving averages.
As for the technical indicator, the Stochastic and RSI 14 demonstrate bullish momentum, recording 35 and 34 in the description, respectively. Furthermore, the Awesome oscillator histogram is green, approaching the signal line from below.
Overall, the technical indicators suggest the primary trend is bearish, but EUR/USD could erase some of its recent losses before the downtrend resumes.
EURUSD Forecast – 8-August-2024

Immediate resistance is at the August 15 low, the $1.095 mark. From a technical perspective, the downtrend will likely resume if bears close and stabilize the EUR/USD price below $1.095. In this scenario, the bearish wave from $1.121 can potentially extend to the next support area at $1.088, the August 16 low.
Please note that the bear market should be invalidated if the Euro price exceeds the $1.109 critical resistance. This level is backed by the 100-period simple moving average and the 50% Fibonacci retracement level of the A.B. wave.
EURUSD Bullish Scenario – 8-August-2024

The current trend is bearish, with the critical resistance/pivot point at $1.109. If bulls (buyers) pull the price above this mark, the trend should be considered bullish.
If this scenario unfolds, the uptick from $1.095 will expedite and target the September 2024 high at $1.121.
EURUSD Support and Resistance Levels – 8-August-2024
Traders and investors should closely monitor the key levels below to make informed decisions and adjust their strategies accordingly as market conditions shift.
- Support: $1.095 / $1.088
- Resistance: $1.102 / $1.105 / $1.109 / $1.121