WTI crude oil futures experienced a significant drop, decreasing over 4% to fall below $74 per barrel this past Tuesday. This decline occurred as the expected supply disruptions due to geopolitical tensions in the Middle East did not happen. Market attention has now turned towards the demand prospects in China.
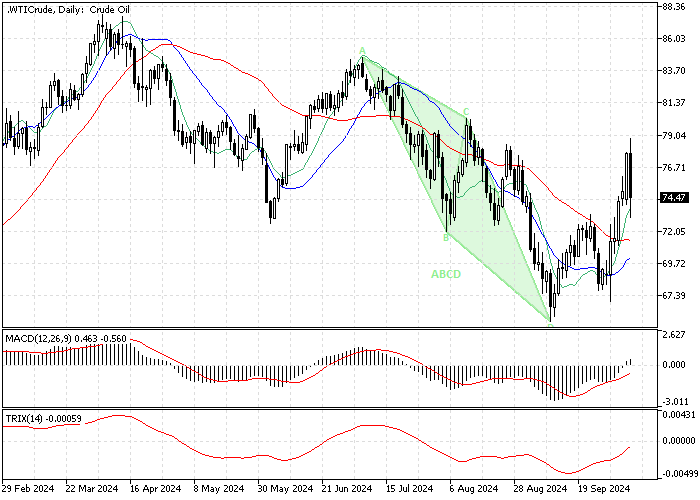
The daily chart below demonstrates the WTI crude oil price at this time.

Lack of Supportive Measures in China
Despite the ongoing economic challenges, China’s National Development and Reform Commission has not introduced any new measures to boost the economy. Without governmental support, there are concerns that China’s economic growth might slow down, potentially reducing the country’s demand for Oil in the near to mid-term.
Impact of Geopolitical Tensions
Oil prices had surged by approximately 13% until Monday, driven by escalating tensions in the Middle East. Following Iran’s launch of around 180 ballistic missiles at Israel last week, there were heightened fears of a potential conflict affecting Iran’s oil industry, especially if Israel were to retaliate.
Oil Technical Analysis – 8-October-2024

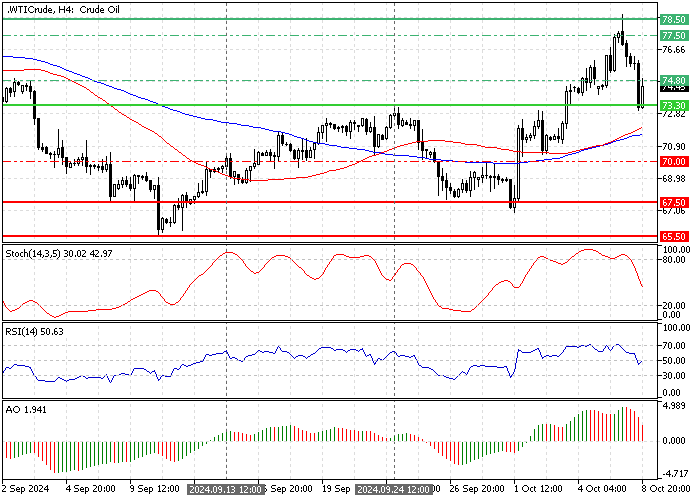
FxNews—The WTI crude oil price dipped from $78.4 as expected because the Stochastic oscillator was above 80, signaling an overbought market.
Furthermore, the decline eased near the $73.3 (September 24 High) resistance. As a result, the price bounced from this point, trading at approximately $74.4, testing the August 28 low as immediate resistance.
The primary trend should also be considered bullish because the price is above the 50- and 100-period simple moving averages. However, the Awesome oscillator histogram is red, approaching the signal line from above, meaning the bear market is strengthening.
The relative strength index indicators also flipped below the media line, signaling the downtrend could resume.
Overall, the technical indicators suggest the primary trend is bullish, but the trend can potentially reverse and fall to the lower support levels.
Crude Oil Price Forecast – 8-October-2024

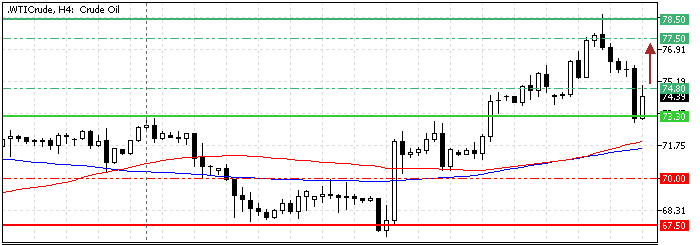
Despite the momentum indicators signaling a trend reversal, the primary trend remains bullish if the price exceeds the 100-period SMA or $73.3. That said, the uptrend will likely resume if the $73.3 resistance holds and bulls pull the price above the immediate resistance at $74.8.
If this scenario unfolds, the Oil price can potentially revisit the $77.5 resistance, followed by the recent high at $78.5.
Please note that the bull market should be invalidated if the price shifts below the 100-period simple moving average.
Crude Oil Bearish Scenario – 8-October-2024

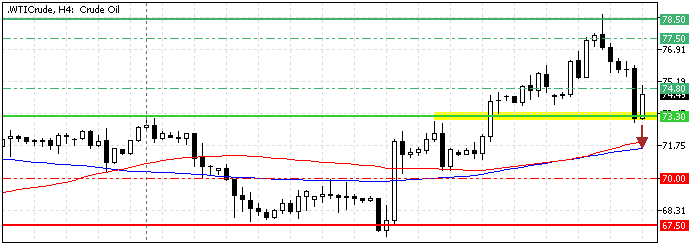
The immediate support rests intact at $73.3. If bears (sellers) close and stabilize the price below that mark, the bearish wave that began this week could extend to the 100-period SMA at approximately $71.4.
Furthermore, if the selling pressure exceeds $71.4, the next supply area that sellers could target is the September 13 low of $70.
Crude Oil Support and Resistance Levels – 8-October-2024
Traders and investors should closely monitor the key levels below to make informed decisions and adjust their strategies accordingly as market conditions shift.
- Support: $73.3 / $71.4 / $70.0 / $67.5
- Resistance: $74.8 / $77.5 / $78.5 / $80.0