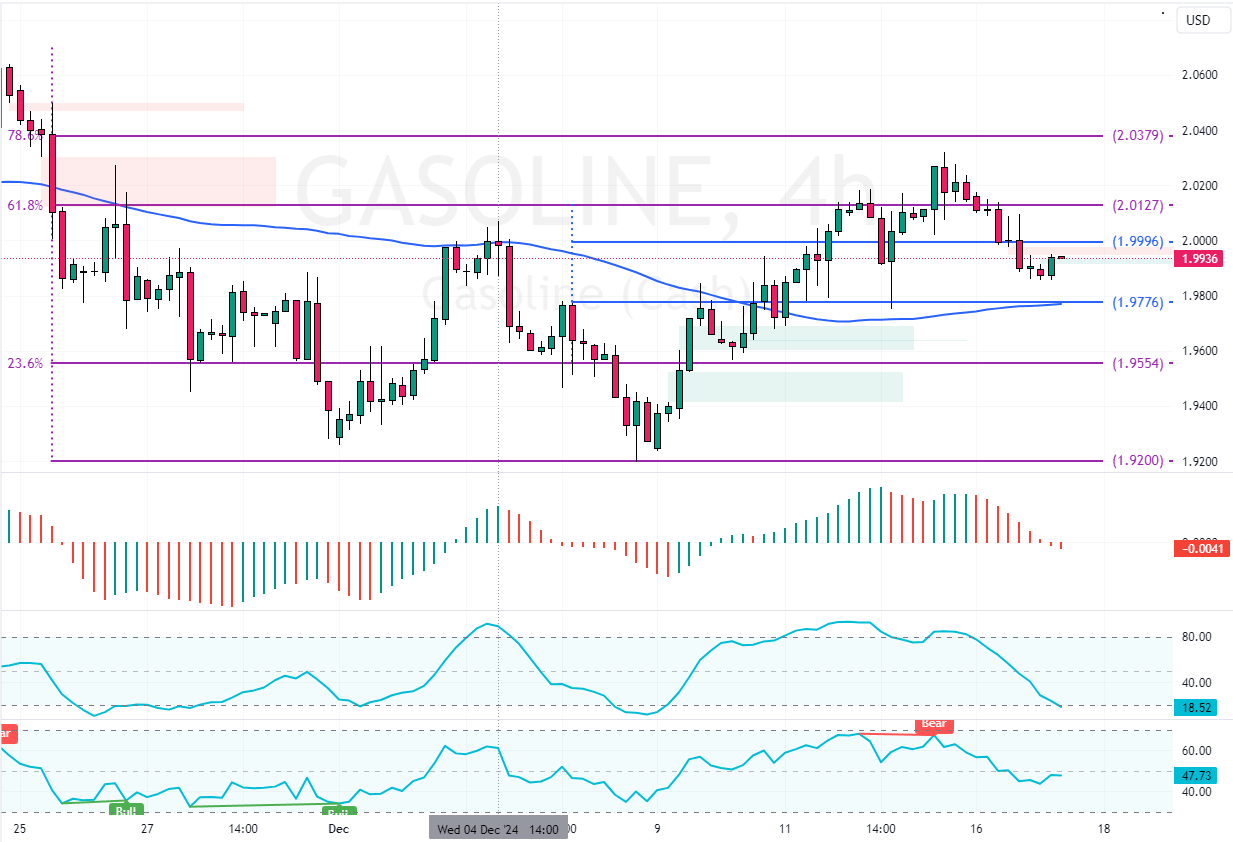
Gasoline prices dropped below $1.99, which is active resistance. The Awesome Oscillator bars are red, below the signal line, hinting that the bear market should prevail.
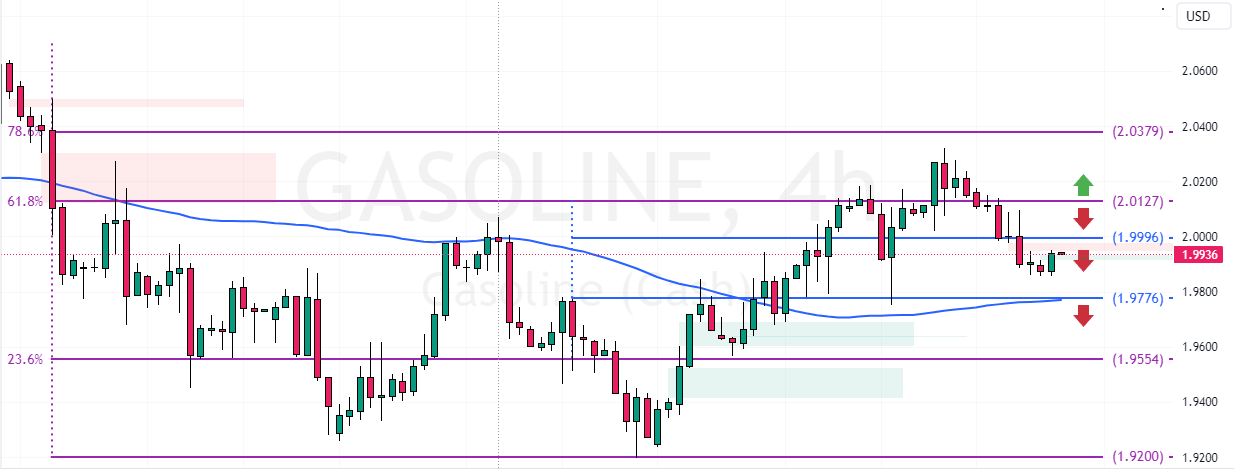
If the $1.99 resistance holds, the next bearish target could be $1.97, backed by the 75-period SMA.

Gasoline Analysis – 17-December-2024
As of this writing, the commodity in discussion trades at approximately $1.994, stabilizing below the $1.999 resistance. Despite the recent decline, the Gasoline’s trend outlook should be considered bullish because the prices are above the 75-period simple moving average, the $1.977 mark.
As for the technical indicators, the Awesome Oscillator has red bars below the signal line. Additionally, the Stochastic and RSI 14 are 23 and 48 in value, meaning the market is not oversold.
Overall, the technical indicators suggest while the primary trend is bullish, the current downtrend could extend to a lower support level.
$1.99 Resistance Spurs Lower Gas Price Forecast

The immediate resistance is at $1.999. From a technical perspective, Gasoline is likely to aim for the 75-period SMA at $1.977 if the resistance holds firm.
Furthermore, the downtrend will likely escalate if the selling pressure exceeds $1.977, targetting the 23.6% Fibonacci support level at $1.955.
The Bullish Scenario
Please note that the bearish outlook should be invalidated if Gasoline prices flip above the $2.012 resistance. If this scenario unfolds, the next bullish target could be $2.03.