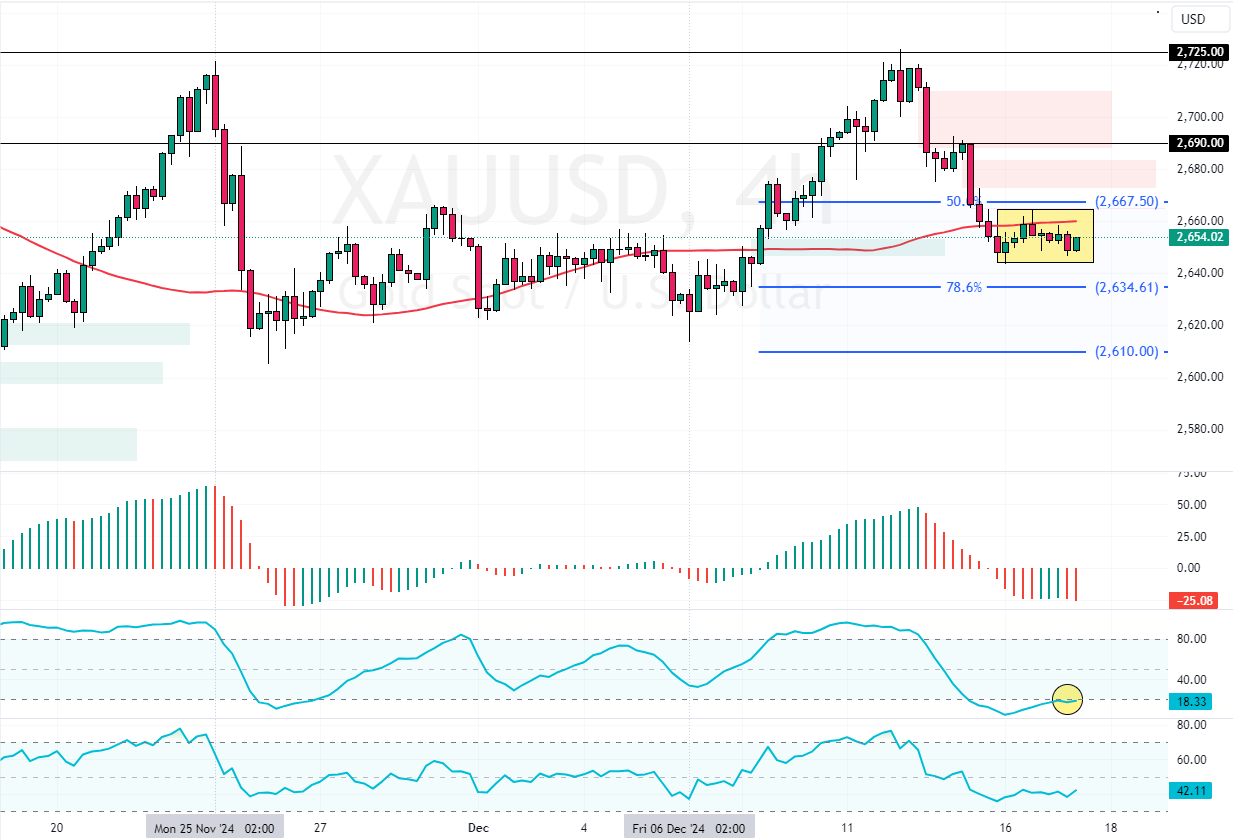
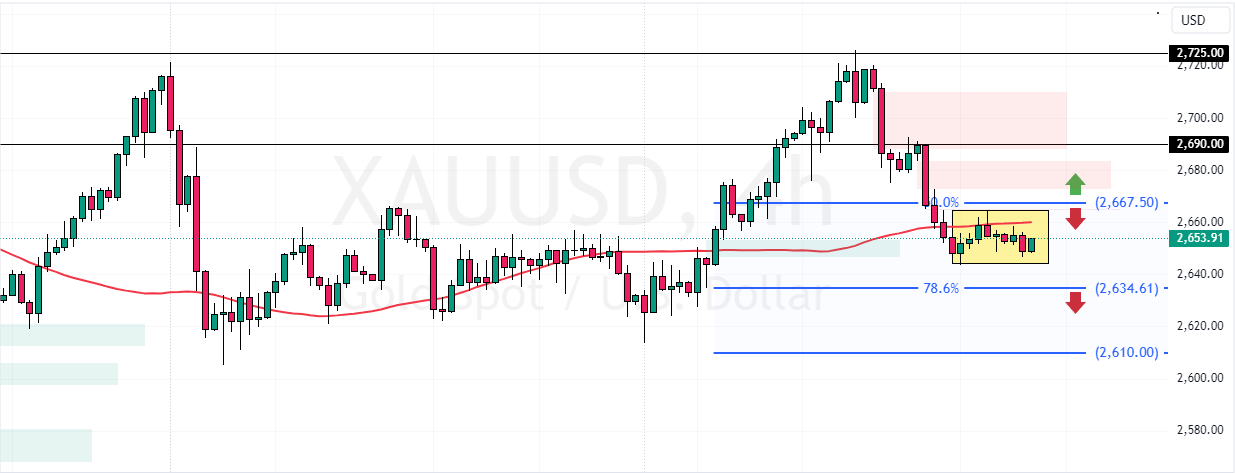
Gold traded sideways after it dipped below $2,667 and the 75-SMA. Meanwhile, Stochastic is oversold, hinting at a possible reversal or a consolidation phase.
If the $2,667 resistance holds, the yellow metal could dip toward the 78.6% Fibonacci support level at $2,634.

Gold Technical Analysis – 17-December-2024
XAU/USD began a strong bearish trend from $2,725, which coincided with the November 25 high. As of this writing, the commodity in discussion is trading in a low-momentum market at approximately $2,652, stabilizing below the 75-period simple moving average.
As for the technical indicators, the Awesome Oscillator histogram is red, below zero, indicating the bear market should prevail. However, Stochastic records show 17, hinting at an oversold market.
Overall, the technical indicators suggest the primary trend is bearish and should resume after a minor consolidation.
Potential Gold Dip to $2634 If Resistance Stands

The immediate resistance is at $2,667. The Gold’s trend outlook remains bearish below this level. In this scenario, the 78.6% Fibonacci support level at $2,636 could be revisited.
Furthermore, if the selling pressure exceeds $2,634, XAU/USD’s decline could extend to the December 6 low at $2,610.
- Good read: Natural Gas Rebound Targets $3.24 and Beyond
The Bullish Scenario
Please note that the bearish outlook should be invalidated if bulls (buyers) close and stabilize above the 50.0% Fibonacci resistance level at $2,667.
If this scenario unfolds, prices could rise toward $2,690, a resistance area backed by the bearish fair value gap.