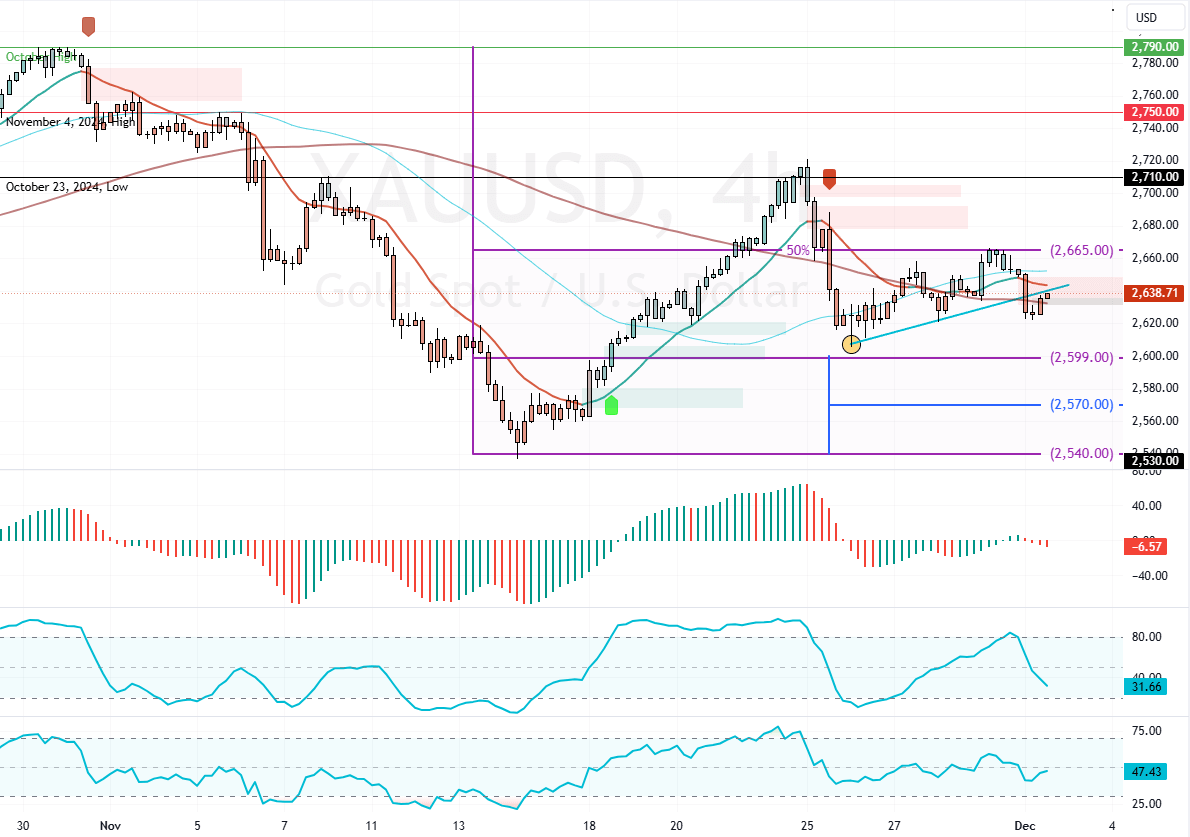
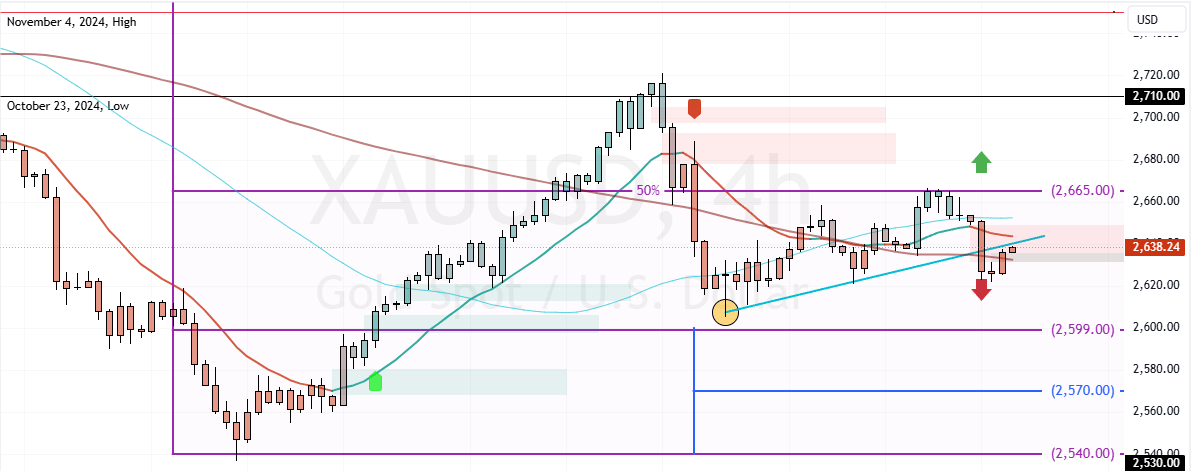
FxNews—Gold shifted below the 100-period simple moving average after it failed to surpass the October 23 low at $2,710, which is active resistance. As of this writing, the yellow commodity trades at approximately $2,635, stabilizing below the ascending trendline while continuing its bearish trajectory.

Gold Technical Analysis
As for the technical indicators, the Awesome Oscillator flipped below zero with red bars. Additionally, the Relative Strength Index hovers around 45, while the Stochastic Oscillator depicts 38 in the description and declining.
Overall, the technical indicators suggest the primary trend is bearish and should extend to lower support levels.
Gold Drops Below 100-SMA Signaling Further Decline

The immediate resistance is at the 50% Fibonacci retracement level, the $2,665 mark. From a technical perspective, the trend outlook remains bearish below this resistance. In this scenario, the next seller’s target could be $2,600.
Furthermore, if the selling pressure pushes XAU/USD below $2,600, the downtrend could extend to $2,570.
Bullish Scenario
Please note that the bear market should be invalidated if Gold prices exceed the critical resistance at $2,665. If this scenario unfolds, the bulls’ path to retest the $2,710 could be paved.