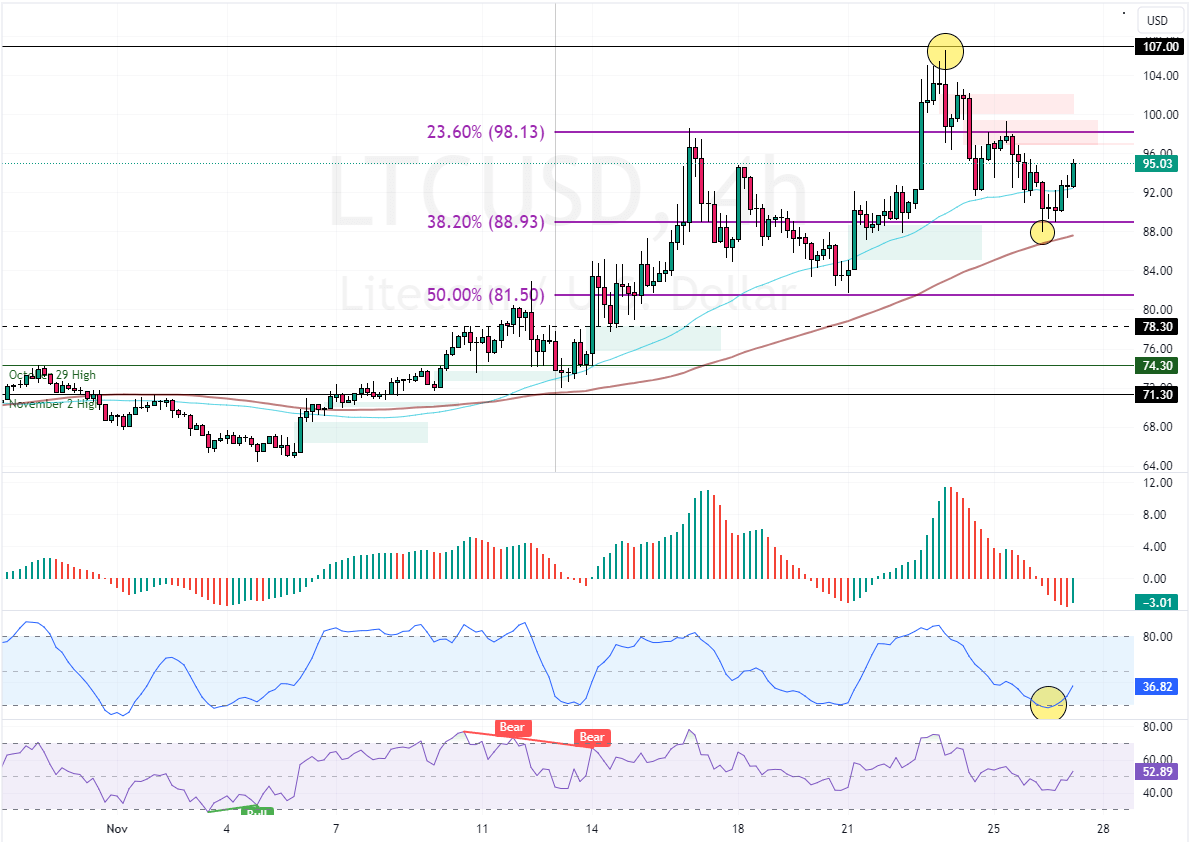
FxNews—Litecoin prices bounced from 38.2% Fibonacci support at almost $88 on Stochastic’s oversold signal. This support, further backed by the 100-period simple moving average, made it a robust supply area.

Litecoin Technical Analysis
The primary trend of the technical indicators should be considered bullish because LTC/USD is above the 50- and 100-period simple moving averages. The Awesome oscillator histogram also turned green, nearing the signal line from below.
Overall, the technical indicators suggest the primary trend is bullish and should resume.
Litecoin Target $98 Amid Strong Bullish Signals
The Litecoin trend outlook remains bullish, with prices above the 38.2% Fibonacci. In this scenario, the crypto will likely target the 23.6% Fibonacci resistance area at $98.0. Furthermore, if Litecoin bulls pull the prices above $98.0, their path to revisiting the November high at $107 could be paved.
- Good read: Bitcoin Nears Key $91000 Support Level
Please note that the bullish outlook should be invalidated if LTC/USD dips below $88.0. If this scenario unfolds, the downtrend from $107 could extend to the 50% Fibonacci retracement support area at approximately $81.5.