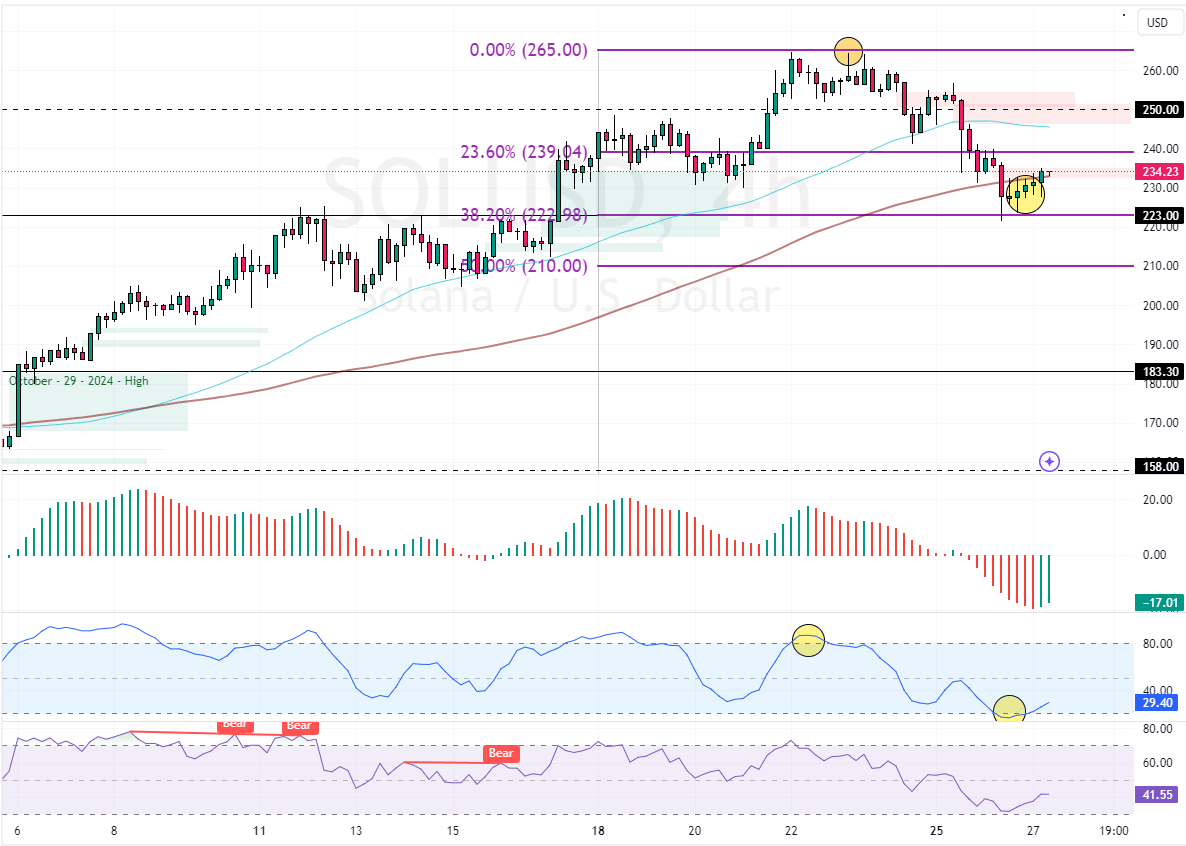
FxNews—Solana’s price downtrend, which began at $265.0, was expected because the Stochastic was signaling overbought, and the 4-hour chart formed a “long upper shadow” candlestick pattern.

Spinning Top Candles Signal Solana’s Potential Upturn
However, the downtrend eased after SOL/USD dipped to as low as $223.0. The selling pressure caused Stochastic to step into the oversold area at this time.
As for the candlestick patterns, a few ‘spinning top white’ candlesticks are found near the 38.2% Fibonacci resistance, which is backed by the 100-period simple moving average.
- Also read: Bitcoin Nears Key $91000 Support Level
Solana Poised for a New Bullish Wave Above $223
The immediate support is $222, backed by the 38.2% Fibonacci retracement level. The outlook for this crypto will remain bullish as long as $222 holds as support. In this scenario, the prices will likely test the 23.6% Fibonacci resistance ($239).
Furthermore, if the buying pressure exceeds $239, the next bullish target could be the 250.0 mark, backed by the bearish fair value gap area.
- Good read: Ethereum Holds Strong Eyeing $3550
Please note that the bullish strategy should be invalidated if bears push Solana below the immediate resistance at $223. If this scenario unfolds, the downtrend could extend to the 50% Fibonacci support at $210.