In the world of precious metals, silver holds a unique position. Its price movements are closely watched by investors and traders alike, as they can provide valuable insights into the overall health of the global economy. In this article, we will delve into Silver technical analysis, focusing on key support and resistance levels and important indicators such as the Relative Strength Index (RSI).
A Dance with the Dollar and Global Events
Bloomberg – Silver prices fell slightly below $23 per ounce after reaching a one-month high on October 20th. This was due to a stronger US dollar, which was boosted by unexpected growth in the US private sector. This growth raised fears about the Federal Reserve’s potential interest rate hikes, which could make it more expensive to hold non-yielding assets like silver.
In Europe, weak economic performance indicators continued to dampen global demand prospects. However, the possibility of increased military conflict in the Middle East and hopes for more stimulus from China provided some support for silver prices.
Now, traders are waiting for the release of US GDP and CPE data, which could provide more insight into the Federal Reserve’s monetary policy.
Silver Technical Analysis – Late October Update
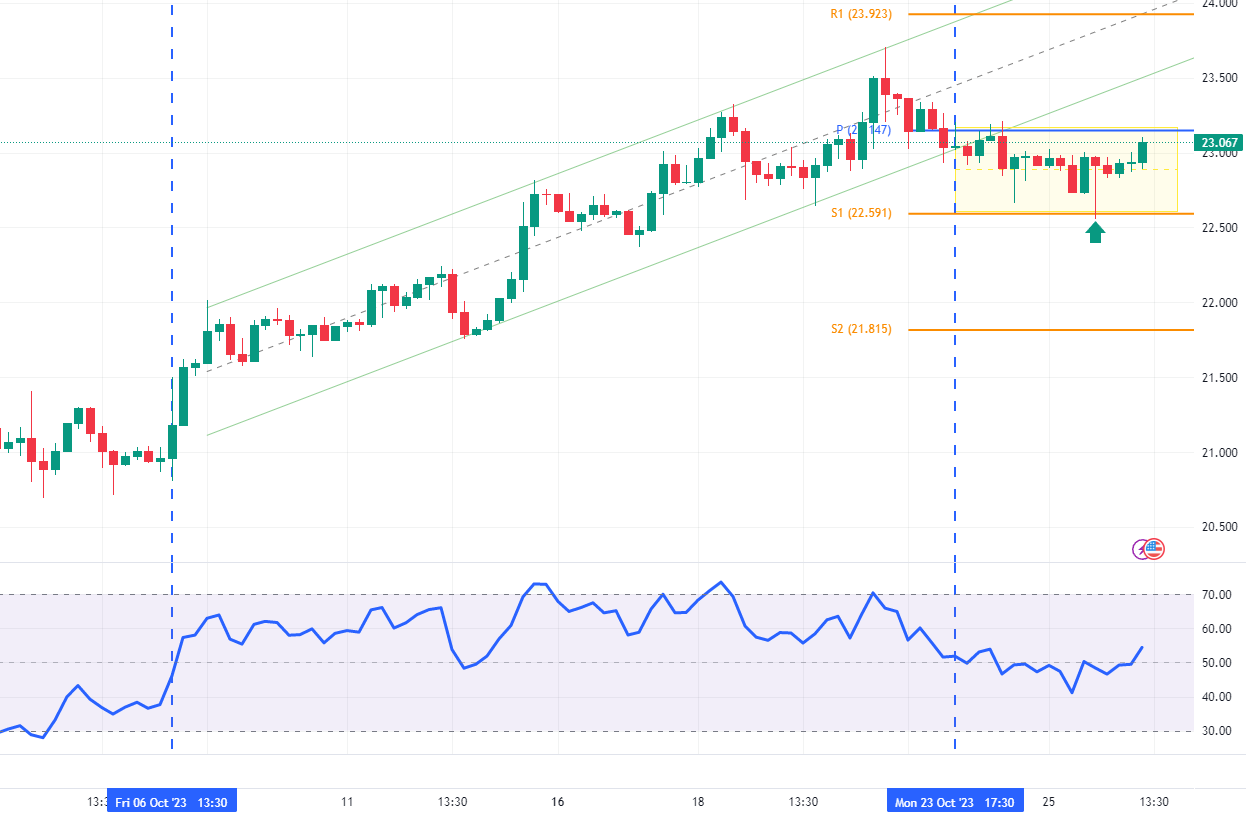
The price of silver is currently testing a crucial pivot point at 23.14. The RSI, a momentum oscillator that measures the speed and change of price movements, is hovering above 50. This suggests that the market is in a state of equilibrium, with neither the bulls nor the bears gaining an upper hand.

Since the XAGUSD (the ticker symbol for silver) failed to close below the S1 support level at 22.59, the range price movement since October 23 can be considered a correction to the rise initiated early this month. This indicates that the market is taking a breather after significant upward movement.
The pivot point at 23.14 serves as a barrier to the bulls. Bulls must close above this pivot point to push the price to R1 (the first level of resistance) at 23.9. This would signal a continuation of the upward trend and could potentially attract more buyers into the market.
On the flip side, S1 (the first level of support) at 22.5 is crucial in preventing further price declines. If this deck breaks, it could open up room for further downside movement, with the next target for bears being S2 (the second level of support) at 21.8.
In conclusion, silver prices are currently at a crossroads, with key levels on both sides acting as potential turning points. As always, traders should monitor these levels and adjust their strategies accordingly.