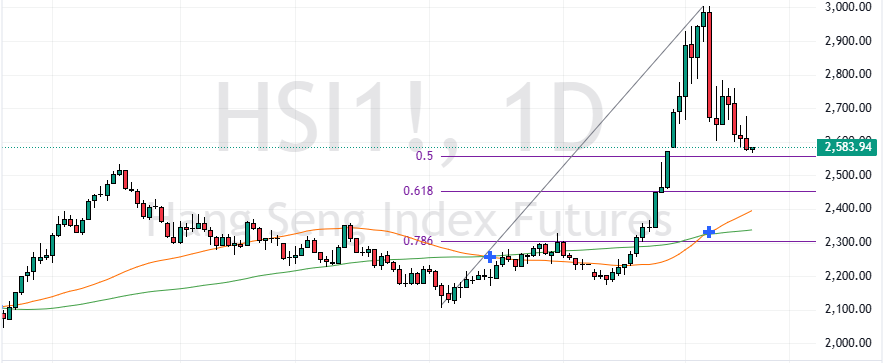
FxNews—Hong Kong’s stock market experienced a significant uplift, rising 227 points, or 1.1%, to 20,509 on Thursday morning. This increase marks a notable recovery after a period of decline over the past three sessions.
The positive momentum from Wall Street, particularly within the technology sector, contributed to this rise. Decreasing U.S. Treasury yields and ongoing corporate earnings reports also played a crucial role.
John Lee’s New Policies Boost Key Hong Kong Sectors
Various sectors saw improvements, with technology, consumer services, and financial sectors leading the gains. This occurred shortly after John Lee, Hong Kong’s leader, announced new initiatives to draw foreign expertise and boost investments in his annual policy address.
Additionally, he reduced the restriction on mortgages and significantly reduced alcohol taxes, which were greater than %30.

Despite the general market upswing, the Hang Seng Property index declined, dropping over 1.2%. This downturn reflects investor caution, particularly with pending updates from the Chinese government on strategies to mitigate the real estate market downturn.
The Hang Seng shares dropped to $20,082, testing the %50 Fibonacci retracement level. If the price falls below this Fibonacci level, the next bearish target could be the $19,000 supply zone.
Stock Surge as China Nears Q3 GDP Announcement
Investors are also bracing for the upcoming release of China’s third-quarter GDP data and September’s activity and carefully monitoring the potential impacts.
Notable stock performers included Tencent Holdings and Meituan, each up by 1.2%, Xiaomi Corp, which rose by 3.1%, and Semiconductor Manufacturing, gaining 2.9%.
USDHKD Technical Analysis – 17-October-2024

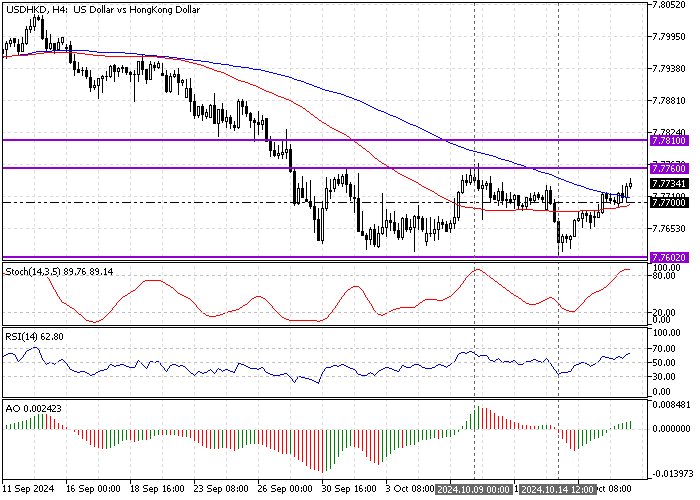
Since late September, the USD/HKD (the U.S. dollar against the Hong Kong dollar) has traded sideways between the 7.7602 support and the 7.776 resistance.
The U.S. dollar began a new bullish wave from 7.7602 on October 14, exceeding the 50- and 100-period simple moving averages. As of this writing, the USD/HKD price is heading toward the 7.776 (October 10 High) critical resistance, trading at approximately 7.773.
As for the technical indicators, the robust buying pressure pushed the Stochastic Oscillator into overbought territory, signaling that the price could bounce from the 7.776 resistance.
On the other hand, the Relative Strength Index is depicted as 63 in the description, meaning the current bullish wave has room to rise further.
It is worth mentioning that the primary trend should be considered bullish because the USD/HKD value is above the 50- and 100-period SMA, backed by the Awesome Oscillator histogram in green, above the signal line.
Overall, the technical indicators suggest the primary trend is bullish, but the USD/HKD price can potentially pull back from the critical resistance level.
USDHKD Forecast – 17-October-2024

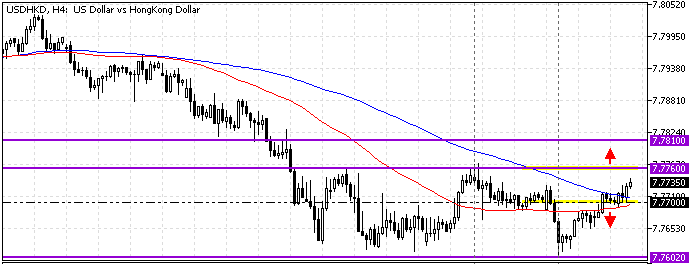
The immediate resistance is at 7.776. If USD/HKD closes and stabilizes above 7.776, the bull market will likely resume. In this scenario, the uptrend could extend to the next resistance level at 7.781 (August 8 Low).
Please be aware that the bullish outlook should be invalidated if USD/HKD falls below the 100-period SMA, the 7.77 mark. If this scenario unfolds, the USD/HKD sideways market remains valid, with bears aiming for the 7.7602 support.
USDHKD Support and Resistance Levels – 17-October-2024
Traders and investors should closely monitor the key levels below to make informed decisions and adjust their strategies accordingly as market conditions shift.
- Support: 7.77 / 7.7602
- Resistance: 7.776 / 7.781