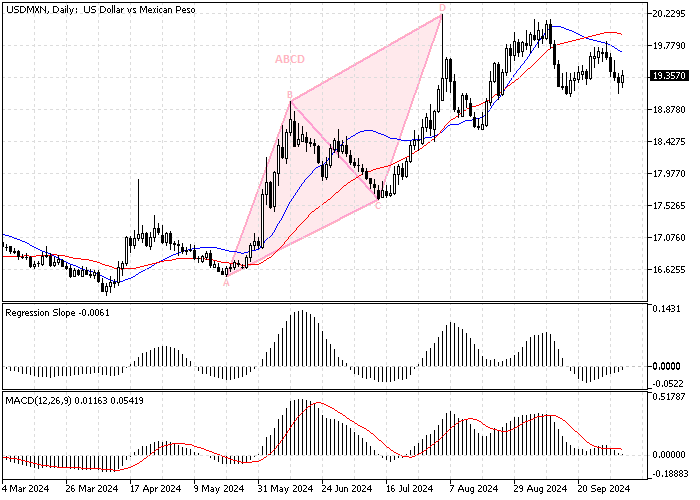
FxNews—The USD/MXN pair has traded sideways since mid-September. It first crossed above the 100-period SMA, and later that month, it crossed below it, a sign of a range and low momentum market.
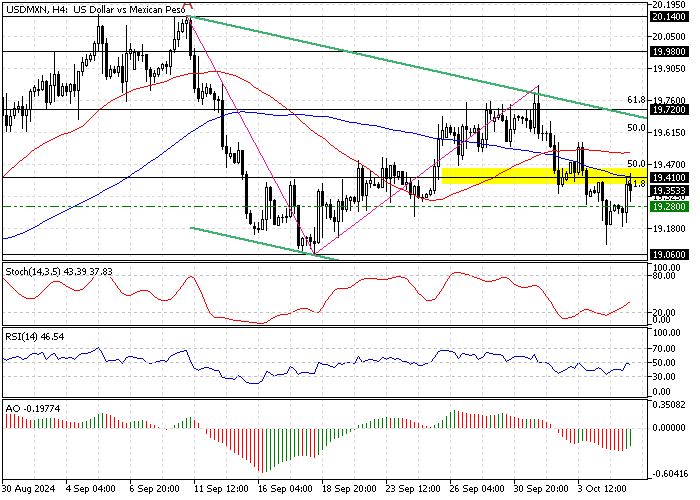
As of this writing, the American currency trades at about 19.41 against the Mexican Peso, testing the 100-period simple moving average as resistance. The 4-hour chart below demonstrates the price, support, resistance levels, and technical indicators utilized in today’s analysis.

USDMXN Technical Analysis – 7-October-2024
The primary trend should be considered bearish because the pair trades below the descending trendline, the 100-period SMA, and the critical resistance at the Fibonacci retracement clusters of the AB wave (61.8% and 50%), which rests at approximately 19.41.

On the other hand, the relative strength index and the Stochastic oscillator show bullish momentum. The indicators are pointing up, not overbought, meaning the uptrend from 19.06 is gaining momentum.
Additionally, the Awesome oscillator histogram turned green and rose toward the signal line from below.
Overall, the technical indicators suggest USD/MXN is a downtrend, but the price can rise.
USDMXN Forecast – 7-October-2024

The immediate resistance is at 19.41. If the bulls close and stabilize the USD/MXN price above 19.41, the bullish wave that began from 19.06 will likely target the 61.9 Fibonacci retracement level of the AB wave.
If this scenario unfolds, the immediate support that backs the uptrend will be the 19.28 (September 24 Low) mark. Please note that the bullish strategy should be invalidated if the price falls below 19.28.
USDMXN Bearish Scenario – 7-October-2024
If bears (sellers) push the USD/MXN conversion rate below the 19.28 support, a new bearish trend will likely emerge. In this scenario, the downtrend from 19.72 could revisit the September 2024 low at 19.06.
Furthermore, if the selling pressure drives the price below 19.06, the downtrend can potentially expand to 18.76, the August 09 low.
Notably, the bearish scenario should be invalidated if the USD/MXN price exceeds the 100-period SMA.
USDMXN Support and Resistance – 7-October-2024
Traders and investors should closely monitor the key levels below to make informed decisions and adjust their strategies accordingly as market conditions shift.
- Support: 19.28 / 19.06 / 18.76
- Resistance: 19.41 / 19.72 / 19.98 / 20.14