FxNews—The U.S. Dollar pullback from 10.40 exceeded the July 9 high at 10.59 against the Swedish Krona. The bullish trajectory drove the stochastic oscillator in the 4-hour time frame above the 80 level, meaning the USD/SEK pair is overbought. As of writing, the pair has tested the key resistance level at 10.59, trading at approximately 10.6, trying to stabilize the recent gains.
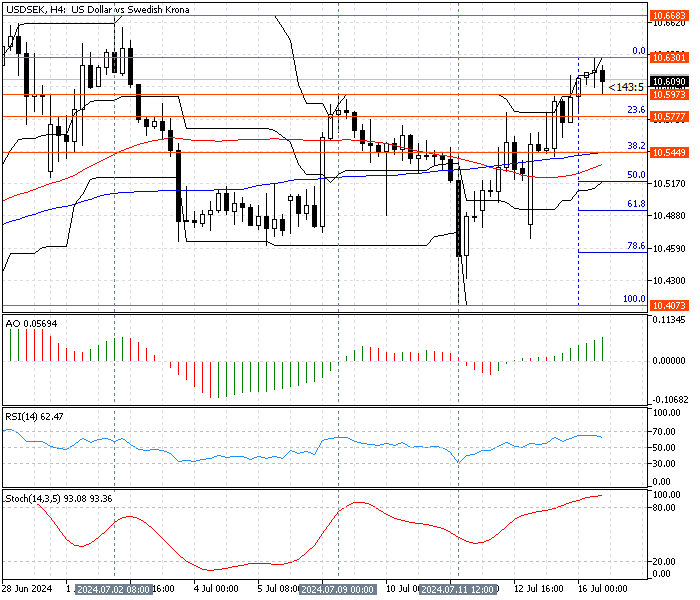
The USD/SEK 4-hour chart below shows the key Fibonacci levels, today’s price, and the technical indicators utilized in this analysis.

USDSEK Technical Analysis – 16-July-2024
The technical indicators in the 4-hour chart suggest the primary trend is bullish, but the U.S. Dollar is overpriced against the Swedish Krona.

- The price is above the 50 and 100-period simple moving averages, meaning we are in an uptrend.
- The awesome oscillator value is 0.05, with green bars above the signal line. This growth in the AO bars indicates that the bull market prevails.
- The relative strength index value hovers around 61 and has room to the overbought area, meaning the price can rise further.
- The stochastic oscillator shows extreme overbought condition with the %K line value showing 93 in the description. This means the USD/SEK price might return from the 10.63 high to test the lower resistance levels.
USDSEK Forecast – 16-July-2024

The immediate resistance level is today’s high at 10.63. Interestingly, the chart formed a shooting star candlestick stick pattern, which signals the trend might reverse or the price might dip. This speculation aligns with the stochastic oscillator hovering in overbought territory.
Therefore, if the USD/SEK price dips below the immediate support at 10.59, the consolidation phase might extend to the 23.6% Fibonacci at 10.57, followed by the 38.2% Fibonacci at 10.54. These two supply areas provide a low-risk decent bid for the retail traders to join the bull market.
Please note that the market is overbought. If the bulls (buyers) cross above the immediate resistance at 10.63, the uptrend will likely resume with the next bullish target at 10.66, the July all-time-high. Yet, in this scenario, we do not recommend joining the bull market because we have been told about going long in an overbought condition.
USDSEK Key Levels – 16-July-2024
Traders and investors should closely monitor the key levels below to make informed decisions and adjust their strategies accordingly as market conditions shift.
- Support: 10.59 / 10.57 / 10.54
- Resistance: 10.63 / 10.66
Disclaimer: This technical analysis is for informational purposes only. Past performance is not necessarily indicative of future results. Foreign exchange trading carries significant risks and may not be suitable for all investors. Always conduct your research before making any investment decisions.