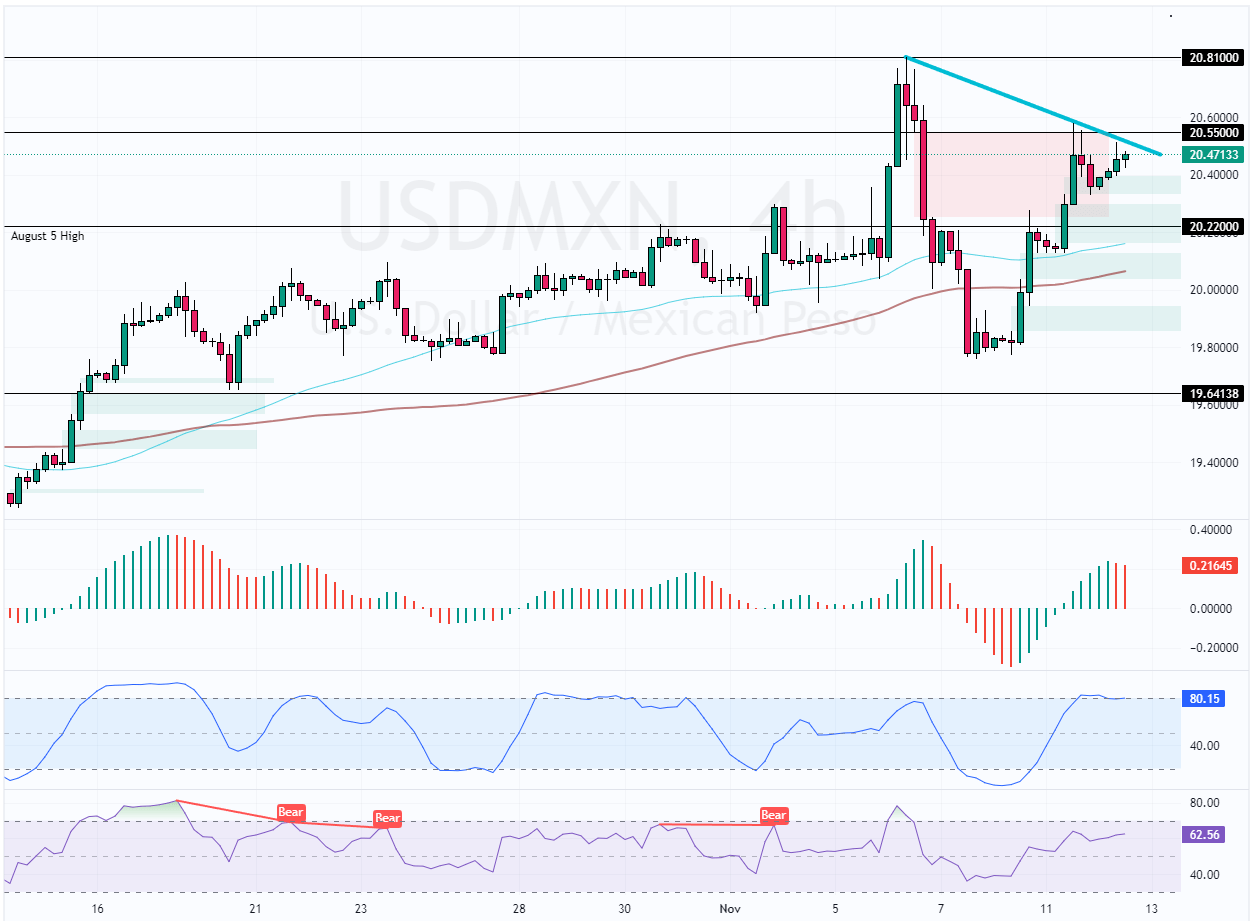
FxNews—The U.S. dollar trades bullish against Mexican Peso above the 100-period simple moving average. As of this writing, the currency pair trades at approximately 10.45, and the 20.55 bearish Fair Value Gap is tested as resistant.
The USD/MXN 4-hour chart below demonstrates the price, support, and resistance levels, as well as the technical indicators utilized in today’s analysis.

USDMXN Technical Analysis – 12-November-2024
The robust buying pressure from 19.8 eased after the price tested the bearish Fair Value Gap at 20.55. Concurrently, the Stochastic Oscillator stepped into the overbought territory, showing 80.1 in the description, meaning the Greenback is overvalued against the Peso.
Furthermore, the Awesome Oscillator histogram started demonstrating bearish signals with red bars above the zero line, meaning the primary trend is bullish but weakening. Additionally, the RSI 14 hovers above the median line, depicting 62 in the description, indicating the bull market should prevail.
Overall, the technical indicators suggest that while the primary trend is bullish, the USD/MXN price may consolidate and erase some of its recent losses near the lower support levels.
USDMXN Forecast – 12-November-2024

The immediate resistance that passed the bullish trajectory rests at 20.55. From a technical standpoint, the uptrend will likely resume if bulls pull USD/MXN above the 20.55 resistance. In this scenario, the next bullish target could be the 20.81 mark (November 6 High).
Please note that the USD/MXN trend outlook remains bullish as long as it is above the 100-period simple moving average or the 20.22 mark. That said, the bullish strategy should be invalidated if the price falls below the 20.22 support.
- Support: 20.22 / 20.0 / 19.64
- Resistance: 20.55 / 20.81