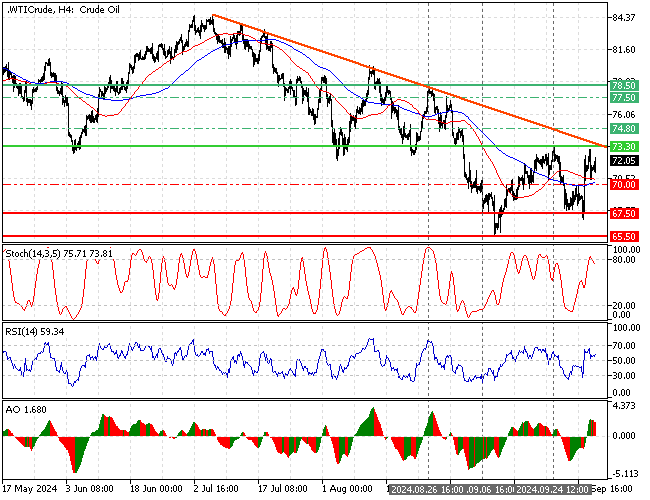
FxNews—WTI Crude Oil experienced a pullback from $67.5 resistance (September 6 Low) and almost had a $4 increase in value till October 1. The black gold tested the September 24 high at $74.3 this week and is trading slightly below it at approximately $72.
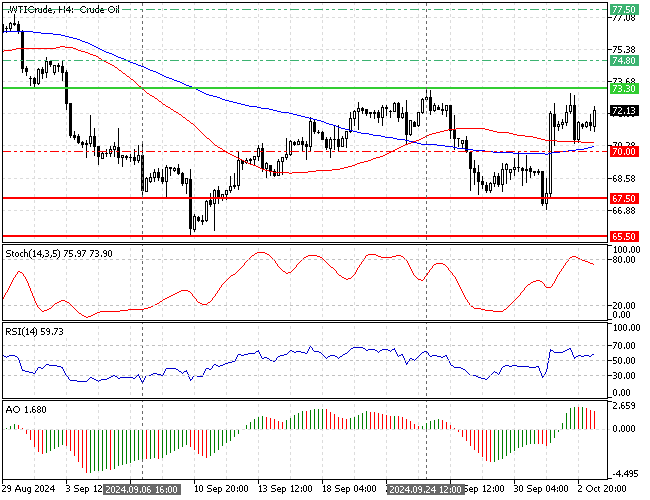
The 4-hour chart below demonstrates the price, support, resistance levels, and technical indicators utilized in today’s analysis.

Crude Oil Technical Analysis – Bulls Face $73.3 Barrier
The primary trend should be considered bearish despite the Oil price being above the 50- and 100-period simple moving average. As shown in the image above, the market could not yet break out from the descending trendline.

The Stochastic oscillator returned below 80, as the Awesome oscillator histogram is red and decreasing. This development in the Stochastic and AO means the bull market is losing its strength and momentum.
Overall, the technical indicators suggest the primary trend is bullish, but the uptrend might step into a consolidation phase or reverse soon.
Crude Oil Price Forecast – 3-October-2024
The immediate resistance rests intact at $73.3. Despite the price being above the 50- and 100-period SMA, the bullish traders must close above $73.3 to resume the uptrend.
If this scenario unfolds, the bullish wave from $67.5 will likely aim for the next resistance level at $74.8 (August 28 Low). Furthermore, if the buying pressure exceeds $74.8, the next critical bullish barrier will be $78.5, the August 26 high.
Please note that the bull market should be invalidated if the Oil price falls below the 100-period SMA or the $70.0 mark.
Crude Oil Bearish Scenario – 3-October-2024

The critical support level lies at the 100-period simple moving average, the $70 mark. If bears (sellers) close and stabilize the price below $70, a new bearish wave targeting the $67.5 support will likely emerge.
Additionally, if the Oil price experiences more losses and closes below $67.5, the following supply area will be the September 2024 low at $65.5.
Crude Oil Support and Resistance Levels – 3-October-2024
Traders and investors should closely monitor the key levels below to make informed decisions and adjust their strategies accordingly as market conditions shift.
- Support: $70.0 / $67.5 / $65.5
- Resistance: $73.3 / $74.8 / $77.5 / $78.5