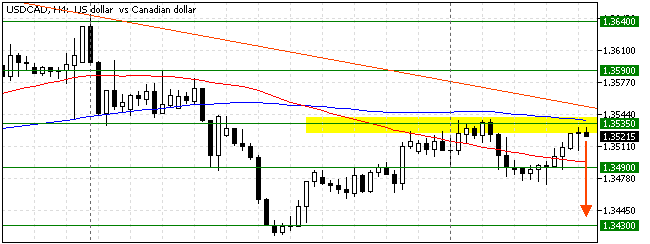
FxNews—The USD/CAD currency pair trades bearish, testing the 100-period simple moving average at approximately 1.353 as of this writing. The 4-hour chart below demonstrates the price, support, resistance levels, and technical indicators utilized in today’s analysis.

USDCAD Technical Analysis – The 1.349 Critical Barrier
The primary trend is bearish because the USD/CAD price trades below the 100-period simple moving average and the descending trendline, shown in the chart above.

However, the Awesome oscillator and the RSI 14 indicator suggest that the bull market can potentially make a bullish breakout. The Awesome oscillator bars are green, flipped above the signal line. Meanwhile, the relative strength index indicator is depicted as 57 in the description and rises above the median line.
Overall, the technical indicators suggest the primary trend is bearish, but the USD/CAD price might rise to upper resistance levels.
USDCAD Forecast – 3-October-2024

The immediate resistance lies at the September 30 high at 1.353, and the currency pair in discussion is in a bear market because it is below the 100-period SMA.
From a technical standpoint, the downtrend remains valid as long as the USD/CAD price is below 1.3535. In this scenario, the bear market should resume and will likely target the 1.349 support (September 30 low).
Furthermore, if the selling pressure pushes USD/CAD below 1.340, the next bearish target could be 1.343, the September 2024 low. Please note that the bear market should be invalidated if the price exceeds the descending trendline at approximately 1.353.
USDCAD Bullish Scenario – 3-October-2024

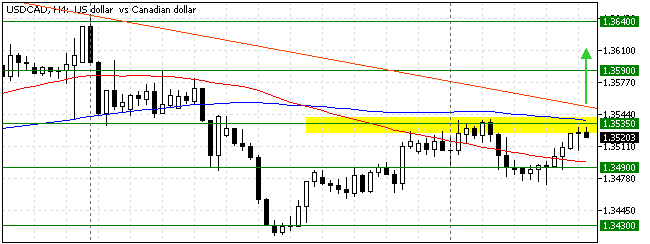
If the bulls (buyers) break above the immediate resistance of 1.353, the pullback or consolidation phase from 1.343 can potentially target the 1.359 mark. Furthermore, if the price exceeds 1.359, the next critical barrier will be the September 19 high at 1.364.
Please note that the bull market should be invalidated if the USD/CAD price dips below the 5-period simple moving average.
USDCAD Support and Resistance Levels – 3-October-2024
Traders and investors should closely monitor the key levels below to make informed decisions and adjust their strategies accordingly as market conditions shift.
- Support: 1.349 / 1.343
- Resistance: 1.353 / 1.359 / 1.364